. 2008 May-Jun;22(3):262-78.
doi: 10.1177/1545968307308550. Epub 2007 Nov 30.

Nogo-66 receptor antagonist peptide (NEP1-40) administration promotes functional recovery and axonal growth after lateral funiculus injury in the adult rat

Affiliations

Nogo-66 receptor antagonist peptide (NEP1-40) administration promotes functional recovery and axonal growth after lateral funiculus injury in the adult rat

Y Cao et al. Neurorehabil Neural Repair. 2008 May-Jun.

Abstract

Objective: The myelin protein Nogo inhibits axon regeneration by binding to its receptor (NgR) on axons. Intrathecal delivery of an NgR antagonist (NEP1-40) promotes growth of injured corticospinal axons and recovery of motor function following a dorsal hemisection. The authors used a similar design to examine recovery and repair after a lesion that interrupts the rubrospinal tract (RST).

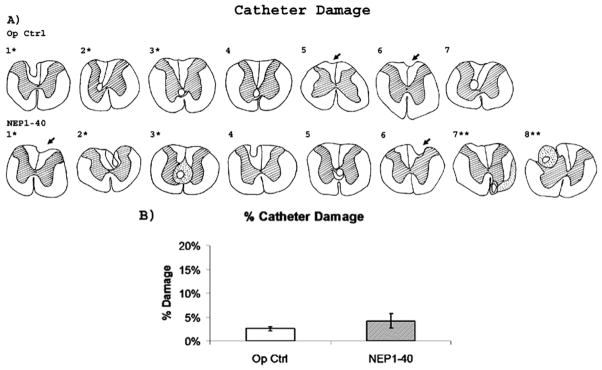
Methods: Rats received a lateral funiculotomy at C4 and NEP1-40 or vehicle was delivered to the cervical spinal cord for 4 weeks. Outcome measures included motor and sensory tests and immunohistochemistry.

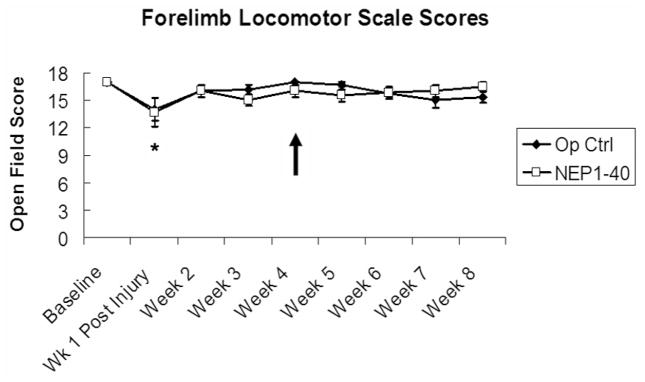
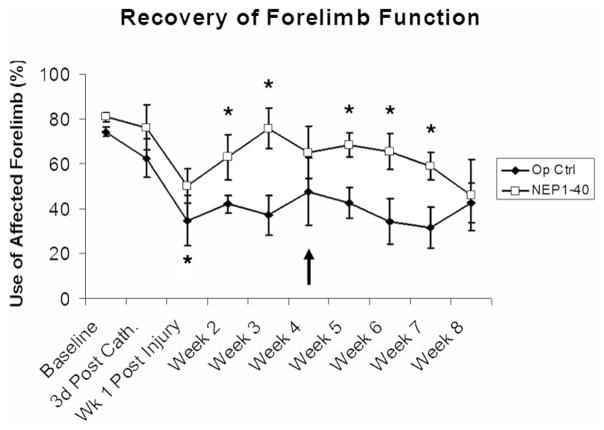
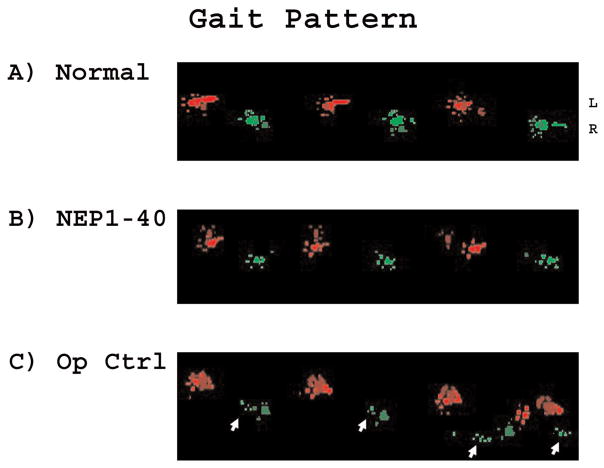
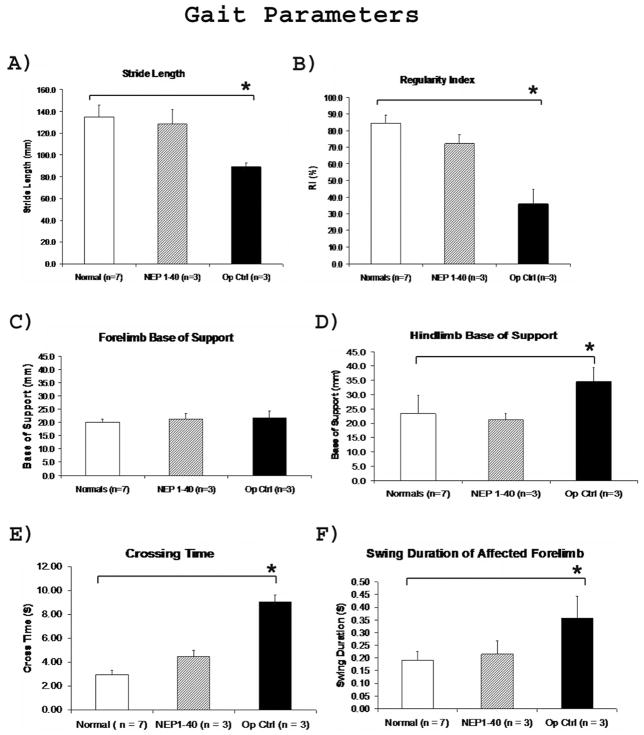
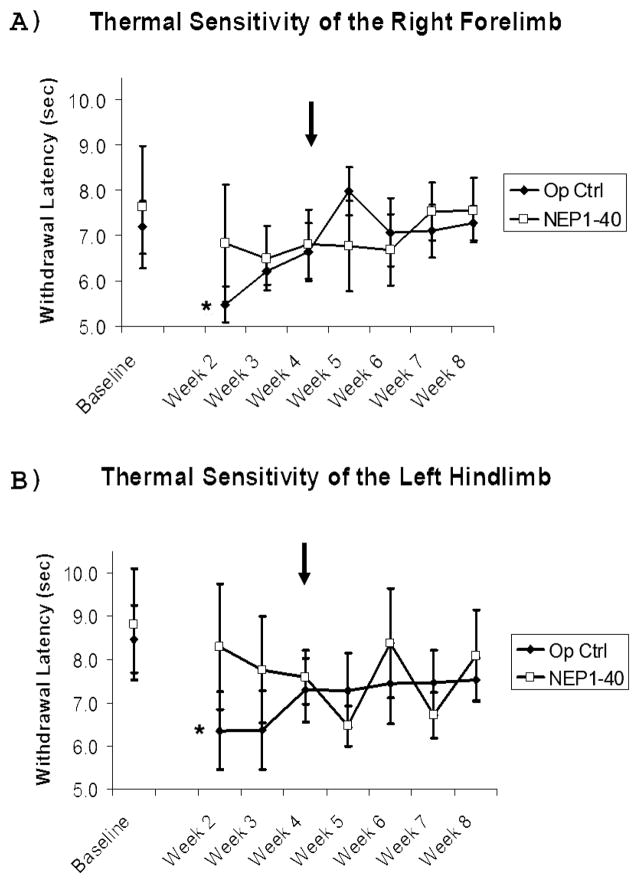
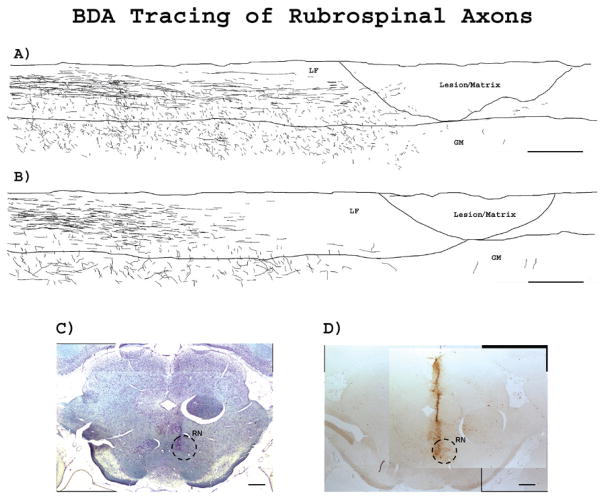
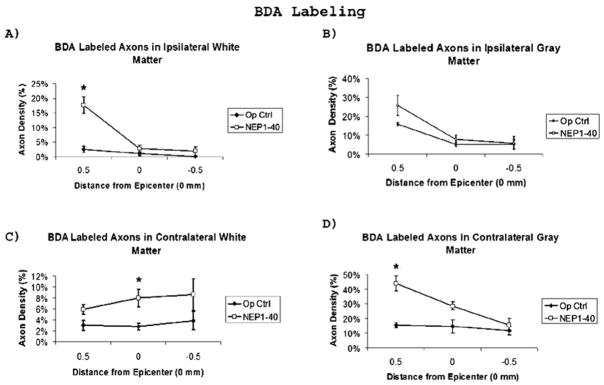
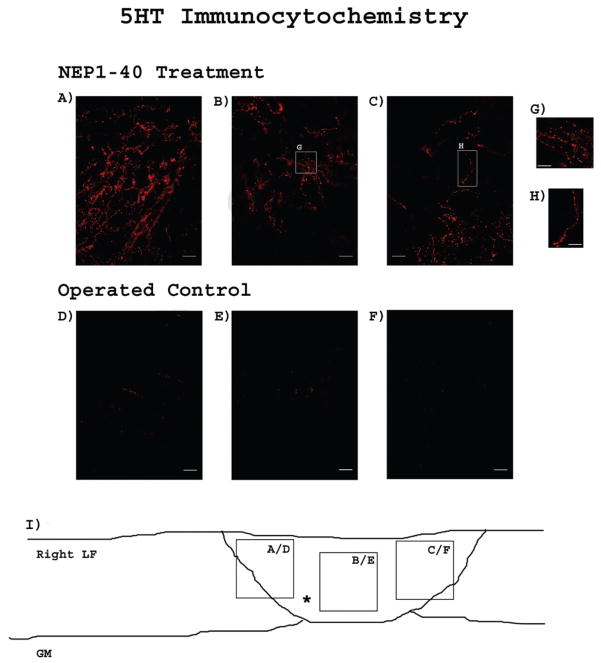
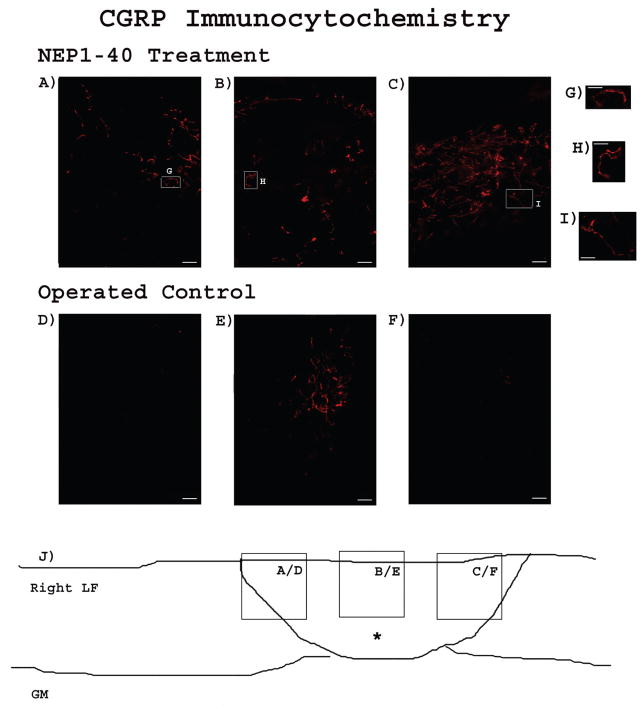
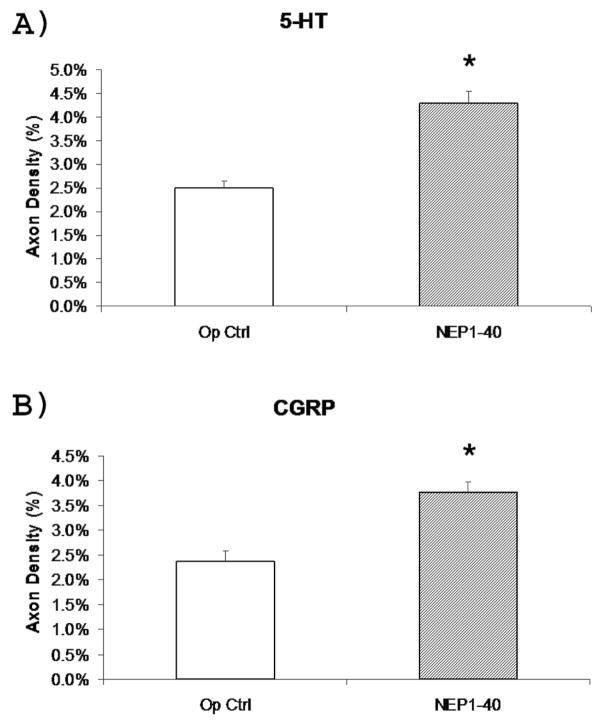
Results: Gait analysis showed recovery in the NEP1-40-treated group compared to operated controls, and a test of forelimb usage also showed a beneficial effect. The density of labeled RST axons increased ipsilaterally in the NEP1-40 group in the lateral funiculus rostral to the lesion and contralaterally in both gray and white matter. Thus, rubrospinal axons exhibited diminished dieback and/or growth up to the lesion site. This was accompanied by greater density of 5HT and calcitonin gene-related peptide axons adjacent to and into the lesion/matrix site in the NEP1-40 group.

Conclusions: NgR blockade after RST injury is associated with axonal growth and/or diminished dieback of severed RST axons up to but not into or beyond the lesion/matrix site, and growth of serotonergic and dorsal root axons adjacent to and into the lesion/matrix site. NgR blockade also supported partial recovery of function. The authors' results indicate that severed rubrospinal axons respond to NEP1-40 treatment but less robustly than corticospinal, raphe-spinal, or dorsal root axons.


Figures

Figure 1
Figure 1
Forelimb Locomotor Scale scores. Both groups showed a significant deficit (*P < .05) 1 week postfuniculotomy followed by almost complete recovery by 2 weeks, with no differences between the operated control group (n = 7) and the NEP1-40 group (n = 6). The catheter delivered either NEP1-40 or vehicle over 4 weeks; cessation of infusion is indicated by the arrow. Data points indicate mean ± SEM.
Figure 2
Figure 2
NEP1-40 treatment improved use of the affected forelimb. No deficit was observed 3 days after the catheter implantation, but significant impairment compared to baseline in the use of the affected forelimb was found at 1 week postfuniculotomy in both groups (*P < .05). The operated control group (n = 7) showed no further recovery. The NEP1-40 group (n = 6) demonstrated further significant recovery compared to operation control (*P < .05), although performance declined to operation control levels at 8 weeks. Arrow indicates cessation of infusion. Data points indicate mean ± SEM.
Figure 3
Figure 3
NEP1-40-treated animals exhibited stepping parameters similar to normal animals. False color images of steps recorded from the CatWalk at 8 weeks postfuniculotomy in representative (A) normal (n = 7), (B) NEP1-40-treated (n = 3), and (C) operated control (n = 3) animals. (Color coding: bright red = left forepaw; dark red = left hindpaw; bright green = right forepaw; dark green = right hind-paw.) (B) At 8 weeks following NEP1-40 treatment, footprint contact areas were similar in size, and forepaw and hindpaw prints overlapped similar to normals. (C) In the operation control group, right footprints did not overlap (arrows), indicating poor interlimb coordination. Contact area of the right forepaw was decreased in size as the left limbs compensated for the dysfunctional right forelimb.
Figure 4
Figure 4
Gait analysis at 8 weeks postfuniculotomy. Data points indicate mean ± SEM. NEP1-40 treatment improved gait parameters: (A) Right forelimb stride length in the operated control group decreased compared with normal animals (*P < .05); the stride length of the NEP1-40-treated group was similar to normals. (B) Regularity Index decreased in operated controls (*P < .05) but was similar to normals after NEP1-40 treatment. (C) Forelimb base of support in both groups of operated animals was similar to normals. (D) Hindlimb base of support increased in operated controls compared to normal animals (*P < .05) but not in NEP1-40-treated animals. (E) Crossing time in the operated control group increased compared with normal animals (*P < .05). The crossing time of the NEP1-40-treated group was similar to normals. (F) Swing duration of the right forelimb increased in operated controls (*P < .05). Swing duration in NEP1-40 rats was similar to normals.
Figure 5
Figure 5
Thermal sensitivity to a heat stimulus. Data points indicate mean ± SEM. (A) Thermal sensitivity of the right fore-limb significantly increased in operated controls compared to baseline (*P < .05) at 2 weeks postinjury but then recovered to preoperative baseline levels. This increase was not evident in the NEP1-40-treated group. There were no significant differences between groups as they recovered to preoperative baseline levels. (B) Thermal sensitivity of the left hindlimb increased in operated controls (*P < .05) at 2 weeks postinjury but then recovered to preoperative baseline levels. This increase was not evident in the NEP1-40-treated group. The catheter delivered either NEP1-40 (n = 6) or vehicle (n = 7) over 4 weeks as indicated by the arrow.
Figure 6
Figure 6
Intrathecal catheterization caused spinal cord damage in both groups. (A) Diagrams show the maximum extent of catheter damage in each animal. The hatched area indicates the gray matter; the stippled area shows dense scar formation. Arrows point to minimal damage to dorsal columns in 2 animals from the operated control (#5, #6) and 2 from the NEP1-40-treated (#1, #6) groups. Two animals in the NEP1-40-treated group (**#7, #8) were removed from the analysis because of the extensive catheter damage to the dorsal and/or ventral column. Three animals from each group (*#1–3) were chosen at 8 weeks postinjury for the Catwalk analysis (Figures 3 and 4). (B) The area of damage caused by the catheter expressed as the percentage of tissue loss showed no difference in the remaining animals between the operated control (n = 7) and NEP1-40-treated (n = 6) groups.
Figure 7
Figure 7
NEP1-40 treatment prevented dieback or promoted growth of BDA-labeled axon. Camera lucida drawings of labeled axons in the ipsilateral lateral funiculus in longitudinal sections from representative (A) NEP1-40 and (B) operated control rats. This composite figure represents stacked drawings made from 21 sections spaced 200 μm apart from each animal. Some axons extended to the rostral edge of the lesion in the NEP1-40 group, but none did in the operated control group. Orientation: right side = rostral to lesion; left side = caudal to lesion. Scale bars = 600 μm. (C) Nissl-myelin staining of the midbrain shows that the needle track reached the red nucleus (circled). Scale bars = 500 μm. (D) BDA staining showed BDA tracer confined to the red nucleus. Scale bars: 500 μm. RN = red nucleus; LF = lateral funiculus; GM = gray matter.
Figure 8
Figure 8
Distribution of BDA-labeled axons around lesion site. To examine the distribution of BDA-labeled axons rostral to, at the epicenter, and caudal to the lesion, axons were counted from (A) ipsilateral lateral funiculus, (B) ipsilateral gray matter, (C) contralateral lateral funiculus, and (D) contralateral gray matter. More BDA-labeled axons were present in the ipsilateral lateral funiculus in the NEP1-40 group rostral to the lesion (A, *P < .05). BDA-labeled axons were also increased contralaterally in white (C) and gray (D) matter (*P < .05). Data points indicate mean ± SEM.
Figure 9
Figure 9
NEP1-40 treatment increased sprouting or regeneration of serotonergic axons into the lesion site. 5-HT positive fibers are present within the lesion site of the NEP1-40-treated group. At 40× magnification, more serotonergic axons can be seen in the (A) rostral, (B) middle, and (C) caudal edge of the lesion in the NEP1-40-treated group. Scale bar = 50 μm. (G) and (H) indicate a single fiber from image (B) and (C), respectively, shown at twice the magnification. Scale bar = 25 μm. The operated control group only showed very few fibers in the (D) rostral edge and (E) middle of the lesion. No serotonergic positive fibers were observed in the (F) caudal edge of the lesion. Scale bar = 50 μm. (I) is an illustration that indicates the location of image A/D, B/E, or C/F within the lesion. *Indicates lesion/matrix site.
Figure 10
Figure 10
NEP1-40 treatment increased sprouting or regeneration of calcitonin gene-related peptide (CGRP)–positive axons into the lesion site. CGRP-positive fibers are present within the lesion site of the NEP1-40-treated group. At 40× magnification, more CGRP axons can be seen in the (A) rostral, (B) middle, and (C) caudal edge of the lesion in the NEP1-40-treated group. Scale bar = 50 μm. (G), (H), and (I) indicate a single fiber from image (A), (B), and (C), respectively, shown at twice the magnification. Scale bar = 25 μm. The operated control group only showed very few fibers in the (D) rostral, (E) middle, and (F) caudal edge of the lesion. Scale bar = 50 μm. (J) is an illustration that indicates the location of image A/D, B/E, or C/F within the lesion. *Indicates lesion/matrix site.
Figure 11
Figure 11
The density of both (A) serotonergic and (B) calcitonin gene-related peptide (CGRP)–positive axons within the lesion/matrix site was increased in the NEP1-40 group (*P < .05). Data points indicate mean ± SEM.

Similar articles

Cited by

References

    1. Hunt D, Coffin RS, Anderson PN. The Nogo receptor, its ligands and axonal regeneration in the spinal cord; a review. J Neurocytol. 2002;31:93–120. - PubMed
    1. Savio T, Schwab ME. Lesioned corticospinal tract axons regenerate in myelin-free rat spinal cord. Proc Natl Acad Sci U S A. 1990;87:4130–4133. - PMC - PubMed
    1. Chen MS, Huber AB, van der Haar ME, et al. Nogo-A is a myelin-associated neurite outgrowth inhibitor and an antigen for monoclonal antibody IN-1. Nature. 2000;403:434–439. - PubMed
    1. Prinjha R, Moore SE, Vinson M, et al. Inhibitor of neurite outgrowth in humans. Nature. 2000;403:383–384. - PubMed
    1. Oertle T, van der Haar ME, Bandtlow CE, et al. Nogo-A inhibits neurite outgrowth and cell spreading with three discrete regions. J Neurosci. 2003;23:5393–5406. - PMC - PubMed

Publication types

MeSH terms