

Orbitofrontal volume deficit in schizophrenia and thought disorder
- PMID: 18056163
- PMCID: PMC2773826
- DOI: 10.1093/brain/awm265
Orbitofrontal volume deficit in schizophrenia and thought disorder
Abstract
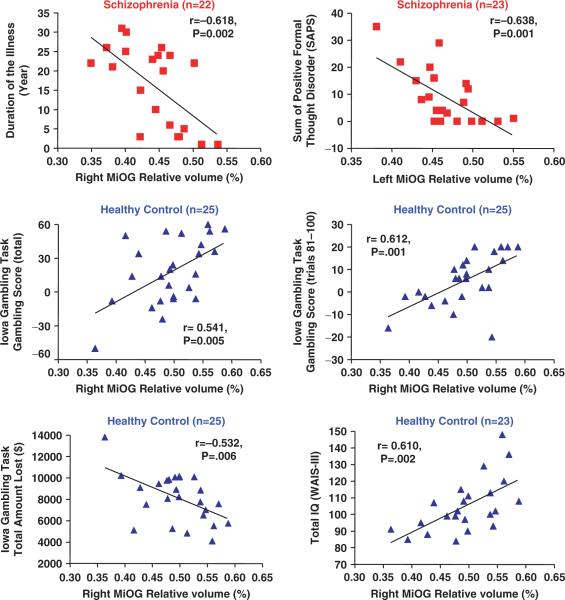
Orbitofrontal Cortex (OFC) structural abnormality in schizophrenia has not been well characterized, probably due to marked anatomical variability and lack of consistent definitions. We previously reported OFC sulcogyral pattern alteration and its associations with social disturbance in schizophrenia, but OFC volume associations with psychopathology and cognition have not been investigated. We compared chronically treated schizophrenia patients with healthy control (HC) subjects, using a novel, reliable parcellation of OFC subregions and their association with cognition, especially the Iowa Gambling Task (IGT), and with schizophrenic psychopathology including thought disorder. Twenty-four patients with schizophrenia and 25 age-matched HC subjects underwent MRI. OFC Regions of Interest (ROI) were manually delineated according to anatomical boundaries: Gyrus Rectus (GR); Middle Orbital Gyrus (MiOG); and Lateral Orbital Gyrus (LOG). The OFC sulcogyral pattern was also classified. Additionally, MiOG probability maps were created and compared between groups in a voxel-wise manner. Both groups underwent cognitive evaluations using the IGT, Wisconsin Card Sorting Test, and Trail Making Test (TMT). An 11% bilaterally smaller MiOG volume was observed in schizophrenia, compared with HC (F(1,47) = 17.4, P = 0.0001). GR and LOG did not differ, although GR showed a rightward asymmetry in both groups (F(1,47) = 19.2, P < 0.0001). The smaller MiOG volume was independent of the OFC sulcogyral pattern, which differed in schizophrenia and HC (chi2 = 12.49, P = 0.002). A comparison of MiOG probability maps suggested that the anterior heteromodal region was more affected in the schizophrenia group than the posterior paralimbic region. In the schizophrenia group, a smaller left MiOG was strongly associated with worse 'positive formal thought disorder' (r = -0.638, P = 0.001), and a smaller right MiOG with a longer duration of the illness (r = -0.618, P = 0.002). While schizophrenics showed poorer performance than HC in the IGT, performance was not correlated with OFC volume. However, within the HC group, the larger the right hemisphere MiOG volume, the better the performance in the IGT (r = 0.541, P = 0.005), and the larger the left hemisphere volume, the faster the switching attention performance for the TMT, Trails B (r = -0.608, P = 0.003). The present study, applying a new anatomical parcellation method, demonstrated a subregion-specific OFC grey matter volume deficit in patients with schizophrenia, which was independent of OFC sulcogyral pattern. This volume deficit was associated with a longer duration of illness and greater formal thought disorder. In HC the finding of a quantitative association between OFC volume and IGT performance constitutes, to our knowledge, the first report of this association.
Figures


Similar articles
-
Altered orbitofrontal sulcogyral pattern in schizophrenia.Brain. 2007 Mar;130(Pt 3):693-707. doi: 10.1093/brain/awm007. Brain. 2007. PMID: 17347256 Free PMC article.
-
Emotional decision-making and its dissociable components in schizophrenia and schizoaffective disorder: a behavioural and MRI investigation.Neuropsychologia. 2008;46(7):2002-12. doi: 10.1016/j.neuropsychologia.2008.01.022. Epub 2008 Feb 7. Neuropsychologia. 2008. PMID: 18329673 Free PMC article.
-
Sexually dimorphic distribution of orbitofrontal sulcogyral pattern in schizophrenia.Psychiatry Clin Neurosci. 2011 Aug;65(5):483-9. doi: 10.1111/j.1440-1819.2011.02229.x. Psychiatry Clin Neurosci. 2011. PMID: 21851457
-
[Decision-making and schizophrenia].Encephale. 2011 Dec;37 Suppl 2:S110-6. doi: 10.1016/S0013-7006(11)70036-7. Encephale. 2011. PMID: 22212839 Review. French.
-
Posterior orbitofrontal sulcogyral pattern associated with orbitofrontal cortex volume reduction and anxiety trait in panic disorder.Psychiatry Clin Neurosci. 2010 Jun;64(3):318-26. doi: 10.1111/j.1440-1819.2010.02085.x. Psychiatry Clin Neurosci. 2010. PMID: 20602731
Cited by
-
Relationship between somatostatin and death receptor expression in the orbital frontal cortex in schizophrenia: a postmortem brain mRNA study.NPJ Schizophr. 2015 Mar 4;1:14004. doi: 10.1038/npjschz.2014.4. eCollection 2015. NPJ Schizophr. 2015. PMID: 27336026 Free PMC article.
-
Multivariate patterns of brain-cognition associations relating to vulnerability and clinical outcome in the at-risk mental states for psychosis.Hum Brain Mapp. 2012 Sep;33(9):2104-24. doi: 10.1002/hbm.21342. Epub 2011 Aug 30. Hum Brain Mapp. 2012. PMID: 22887825 Free PMC article.
-
The use of the orbitofrontal H-sulcus as a reference frame for value signals.Eur J Neurosci. 2020 May;51(9):1928-1943. doi: 10.1111/ejn.14590. Epub 2019 Nov 1. Eur J Neurosci. 2020. PMID: 31605399 Free PMC article.
-
Diagnosing schizophrenia with network analysis and a machine learning method.Int J Methods Psychiatr Res. 2020 Mar;29(1):e1818. doi: 10.1002/mpr.1818. Epub 2020 Feb 5. Int J Methods Psychiatr Res. 2020. PMID: 32022360 Free PMC article.
-
NRN1 epistasis with BDNF and CACNA1C: mediation effects on symptom severity through neuroanatomical changes in schizophrenia.Brain Struct Funct. 2024 Jun;229(5):1299-1315. doi: 10.1007/s00429-024-02793-5. Epub 2024 May 9. Brain Struct Funct. 2024. PMID: 38720004 Free PMC article.
References
-
- Andreasen NC. Scale for the assessment of negative symptoms (SANS) Department of psychiatry; University of Iowa College of medicine; Iowa City, IA: 1981.
-
- Andreasen NC. Scale for the assessment of positive symptoms (SAPS) Department of psychiatry; University of Iowa College of medicine; Iowa City, IA: 1984.
-
- Armstrong E, Schleicher A, Omran H, Curtis M, Zilles K. The ontogeny of human gyrification. Cereb Cortex. 1995;5:56–63. - PubMed
-
- Ashburner J, Friston KJ. Voxel-based morphometry–the methods. Neuroimage. 2000;11:805–21. - PubMed
-
- Baare WF, Hulshoff Pol HE, Hijman R, Mali WP, Viergever MA, Kahn RS. Volumetric analysis of frontal lobe regions in schizophrenia: relation to cognitive function and symptomatology. Biol Psychiatr. 1999;45:1597–605. - PubMed
Publication types
MeSH terms
Grants and funding
LinkOut - more resources
Full Text Sources
Medical
