. 2007 Dec 3;179(5):895-909.
doi: 10.1083/jcb.200705112.

Endoplasmic reticulum remains continuous and undergoes sheet-to-tubule transformation during cell division in mammalian cells

Affiliations

Endoplasmic reticulum remains continuous and undergoes sheet-to-tubule transformation during cell division in mammalian cells

Maija Puhka et al. J Cell Biol. .

Abstract

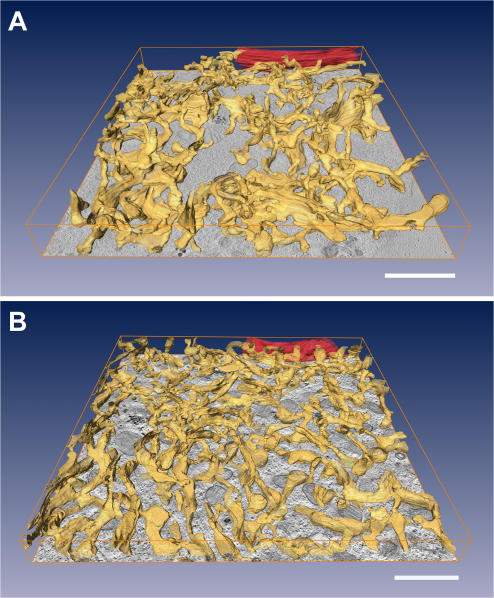
The endoplasmic reticulum (ER) is a multifaceted cellular organelle both structurally and functionally, and its cell cycle-dependent morphological changes are poorly understood. Our quantitative confocal and EM analyses show that the ER undergoes dramatic reorganization during cell division in cultured mammalian cells as mitotic ER profiles become shorter and more branched. 3D modeling by electron tomography reveals that the abundant interphase structures, sheets, are lost and subsequently transform into a branched tubular network that remains continuous. This is confirmed by observing the most prominent ER subdomain, the nuclear envelope (NE). A NE marker protein spreads to the mitotic ER tubules, although it does not show a homogenous distribution within the network. We mimicked the mitotic ER reorganization using puromycin to strip the membrane-bound ribosomes from the interphase ER corresponding to the observed loss of ribosomes normally occurring during mitosis. We propose that the structural changes in mitotic ER are linked to ribosomal action on the ER membranes.


Figures

Figure 1.
Figure 1.
Morphology and overall distribution of the interphase ER. (A) A maximum intensity projection of a deconvoluted confocal stack of Hsp47-GFP/CHO-K1 cells showing that the ER network is denser in the perinuclear area of the cell. Bar, 5 μm. (B) Labeling with peroxidase cytochemistry in ssHRP-KDEL/CHO-K1 cells. Interphase cells sectioned parallel (a) or perpendicular to the coverslip (dashed line, b) have long ER profiles of tubules and sheets (sh). The ER branch points (arrows), exit sites (*), and NE are indicated. The small inset shows the overall distribution of the ER. Bars are 0.5 μm in high and 5 μm in low magnification images.
Figure 2.
Figure 2.
Electron tomographic analysis of the interphase ER from two different cell depths. (A and B) Three successive 200- or 250-nm thick sections from two ssHRP-KDEL/CHO-K1 cells were subjected to ET. The sections were the first ones from the bottom of the cell next to the coverslip (A) or from the middle of the cell depth (B) and show long interconnected tubules in the cell periphery and sheets in the more central parts of the cell (illustration demonstrates the cell depth where sections for imaging were selected). In A, (b) is a side view of the model in (a), and reveals the flat area of the lamellipodia. The ER is modeled in yellow and the NE in red. In B, the Golgi area is highlighted with darker gray. Bars, 2 μm. (C) Models of the different types of branch points between two sheets (a and Video 1), a sheet and a tubule (b), or two tubules (c). Bars, 500 nm.
Figure 3.
Figure 3.
Confocal microscopy analysis of the ER throughout the cell cycle. Confocal optical sections of CHO-K1 cells expressing Hsp47-GFP (a–e) or ssGFP-KDEL (f) were obtained throughout the cell cycle. DNA was stained in vivo (in lilac). The ER of an interphase cell (a) shows a typical polygonal structure with denser network in the perinuclear area than in the periphery of the cells. Arrowheads indicate long tubules found in the cell periphery. In contrast to the interphase ER, the mitotic ER was denser and more evenly distributed. The spindle region excluding ER is visible in metaphase (c) and late anaphase (d) cells. The other phases shown are prometaphase (b), early telophase (e) and metaphase (f). Bars, 5 μm; bar in image f applies to images b–f.
Figure 4.
Figure 4.
Labeling of the ER network with peroxidase cytochemistry in mitotic ssHRP-KDEL/CHO-K1 cells. The ER network lacks long ER profiles in prometaphase (a), metaphase (b), late anaphase (c), and telophase (d) cells, and has many branch points especially during metaphase. The small insets show the cell cycle phase and the overall distribution of the ER profiles. ER branch points (arrows), mitotic Golgi clusters (G), chromosomes (Chr) and NE are indicated. Bars are 0.5 μm in high and 5 μm in low magnification images.
Figure 5.
Figure 5.
Morphometric analysis of ER branch points and profile lengths. Quantification was done from confocal images of Hsp47-GFP (B and C) and from EM images of ssHRP-KDEL (D and E) expressing cells. (A) Stacks of optical sections (a, prophase section shown) were deconvoluted (b) and a skeleton model (c) of the ER network was formed by ImagePro software showing branch points in red and ER profiles in white. Bar, 5 μm. (B) The number of branch points per ER area increased during mitosis and reached a peak value in metaphase. The branch point numbers were statistically different from the interphase values (P < 0.01) in all phases of mitosis. (C) Mitotic cells showed a clear increase in short 0.2–0.4 and 0.4–0.8 μm ER profiles (P < 0.05 except for telophase 0.2–0.4 μm) as compared to interphase cells. INTER = interphase (n = 11 cells), PRO = prophase to prometaphase (n = 16), META = metaphase (n = 9), ANA = anaphase (n = 9), TELO = telophase (n = 7). (D) The number of branch points per ER area increased from interphase to metaphase and returned to the interphase level after mitotic exit. The branch point number in metaphase was statistically different from the interphase value (P < 0.001). (E) Mitotic cells had a significantly increased proportion of short ER profiles (0.040–0.400 μm) and reduced proportion of long profiles (>1.000 μm) as compared to interphase cells (P < 0.001). This pattern was most pronounced in metaphase cells. INTER (n = 22), PRO (n = 18), META (n = 15), ANA (n = 14), TELO (n = 18). The values are presented as the mean ± SEM.
Figure 6.
Figure 6.
Electron tomographic analysis of the ER in interphase and metaphase cells. Successive semi-thick sections (200 nm) from ssHRP-KDEL/CHO-K1 cells were subjected to ET. The modeled ER in the interphase cell appeared mostly as sheets both in sections cut parallel (A, combined from 3 sections) and perpendicular (B and Video 2, combined from 4 sections) to the coverslip. The structure of the ER in metaphase cell appeared tubular and lacked sheets (C and Video 3, combined from 2 sections). The insets are EM micrographs at low magnification to indicate the phase of the cell cycle. The illustration shows the depth of the modeled volume of cells. Note that A and B are from separate cells. Bars are 500 nm, and in insets 2 μm.
Figure 7.
Figure 7.
EM analysis of the NE throughout the cell cycle. Cytochemically stained LBR-HRP/CHO-K1 cells during interphase (a) and early prophase (b, boxed area enlarged in c), prometaphase (d and e), metaphase (f), anaphase (g), and telophase (h). The NE marker dispersed to the reticular ER after the NE breakdown and started to accumulate back to the reforming NE during late anaphase. Unstained ER tubules (arrowheads) were frequently observed next to or continuous with stained ER tubules (arrows) during all phases of mitosis. Cross-sections of nuclear pores (open arrows), chromosomes (Chr), NE, and centrioles (*) are indicated. Bars are 0.5 μm in high (c, d–h) and 5 μm in low magnification images.
Figure 8.
Figure 8.
Electron tomographic analysis of the NE in mitotic cells. Successive semi-thick sections (200 or 250 nm) from LBR-HRP/CHO-K1 cells were subjected to ET. (A) In the prometaphase cell, the modeled ER (combined from 3 sections) showed mostly tubular structure, however, the remnants of the NE could be observed as darkly stained profiles (arrowheads in inset A). (B) During metaphase, the NE marker protein could be found dispersed in the tubular ER network (combined from 3 sections). (C) The telophase ER still had mostly tubular structure (combined from 4 sections), although the NE marker started to accumulate in the small sheet structures around the chromosomes. ER is modeled in yellow, darkly stained membranes in red, and chromosomes in light brown. The insets are EM micrographs indicating the cell cycle phase. Bars are 500 nm, and in insets 2 μm.
Figure 9.
Figure 9.
Comparison of ER-bound ribosomes in untreated interphase or mitotic, and cycloheximide or puromycin treated interphase CHO-K1 cells. (A) Thin-section EM analysis of untreated interphase (a) and mitotic prometaphase to early anaphase (b) cells, and interphase cells treated with cycloheximide (c and d) or puromycin (e and f) for 15 min or 2 h, respectively. Analysis revealed ER membranes covered with ribosomes in untreated and 15-min cycloheximide-treated interphase cells, whereas the ER in mitotic, puromycin treated and 2-h cycloheximide-treated cells had reduced number of ribosomes. Bars, 200 nm. (B) Relative amount of ribosomes on ER membrane quantified from thin-section EM images. (C) The small ribosomal subunit protein S6 was stained in semi-permeabilized salt-washed Hsp47-GFP/CHO-K1 cells for immunofluorescence analysis. Results are expressed as relative staining intensity per cell. In B and C, the values are presented as the mean ± SEM (P < 0.001 in cycloheximide [cyclo] 2 h, and puromycin [puro] 15 min and 2 h).
Figure 10.
Figure 10.
ET analysis of cycloheximide- or puromycin-treated interphase cells. The interphase ER (yellow) was modeled from three successive sections (250 nm) of ssHRP-KDEL/CHO-K1 cells treated for 15 min either with cycloheximide (A) or puromycin (B). The ER in cycloheximide-treated cell was composed of tubules and sheets whereas puromycin-treated cell had only tubular ER. The NE is modeled in red. Illustration in Fig. 2 (box B) demonstrates the cell depth where sections for imaging were selected. Bars, 1 μm.

Similar articles

Cited by

References

    1. Andrade, J., H. Zhao, B. Titus, S. Timm Pearce, and M. Barroso. 2004. The EF-hand Ca2+-binding protein p22 plays a role in microtubule and endoplasmic reticulum organization and dynamics with distinct Ca2+-binding requirements. Mol. Biol. Cell. 15:481–496. - PMC - PubMed
    1. Bannykh, S.I., T. Rowe, and W.E. Balch. 1996. The organization of endoplasmic reticulum export complexes. J. Cell Biol. 135:19–35. - PMC - PubMed
    1. Baumann, O., and B. Walz. 2001. Endoplasmic reticulum of animal cells and its organization into structural and functional domains. Int. Rev. Cytol. 205:149–214. - PubMed
    1. Bobinnec, Y., C. Marcaillou, X. Morin, and A. Debec. 2003. Dynamics of the endoplasmic reticulum during early development of Drosophila melanogaster. Cell Motil. Cytoskeleton. 54:217–225. - PubMed
    1. Connolly, C.N., C.E. Futter, A. Gibson, C.R. Hopkins, and D.F. Cutler. 1994. Transport into and out of the Golgi complex studied by transfecting cells with cDNAs encoding horseradish peroxidase. J. Cell Biol. 127:641–652. - PMC - PubMed

Publication types

MeSH terms