. 2007 Dec 1;67(23):11209-17.
doi: 10.1158/0008-5472.CAN-06-4351.

c-myc Repression of TSC2 contributes to control of translation initiation and Myc-induced transformation

Affiliations

c-myc Repression of TSC2 contributes to control of translation initiation and Myc-induced transformation

Michael J Ravitz et al. Cancer Res. .

Abstract

The c-myc oncogene plays a key role in cellular growth control, and translation initiation factors are among the transcriptional targets of Myc. Here, we describe a defect in translation initiation control in myc-null cells due to alterations in the mammalian target of rapamycin (mTOR) pathway. Myc loss increased sensitivity to dominant inhibition of eukaryotic translation initiation factor 4E function. Polysomal profiles of myc(-/-) cells revealed decreased translation initiation rates, which were accompanied by decreased 40S/60S ribosomal subunit ratios. Because the 40S small ribosomal subunit contains the key regulatory ribosomal protein S6 (rpS6), we considered that myc loss might affect expression of components of the mTOR signaling pathway that regulate rpS6 function. Among mTOR signaling components, Myc directly affected transcription of tuberous sclerosis 2 (TSC2), as shown by quantitative mRNA analysis and by Myc binding to its promoter in chromatin immunoprecipitation assays. Importantly, Myc acted as a strong and direct repressor for TSC2 expression because its loss increased TSC2 mRNA in myc-null and in HL60 shRNA experiments, activation of a mycER construct in myc(-/-) cells suppressed TSC2 induction in a myc box II-dependent manner, and mycER activation recruited Myc to the TSC2 promoter. The biological significance of the effect of Myc on TSC2 expression was shown by markedly reduced TSC2 mRNA levels in myc-transformed cells, stimulation of S6 kinase activity in myc-null cells by TSC2 siRNA, and decreased Myc-induced soft agar colony formation following retroviral transduction of TSC2. Together, these findings show that regulation of TSC2 can contribute to the effects of Myc on cell proliferation and neoplastic growth.


Figures

Figure 1
Figure 1
Myc-null cells are defective in translation initiation. A, myc−/− cells do not tolerate expression of an activated 4EBP mutant that constitutively blocks translation initiation. Myc+/+ and myc−/− cells were transfected with the indicated constructs expressing a control vector (Vec), eIF4E (eIF4E), wild-type 4EBP (4EBP), or a 4EBP mutant of which the serine phosphorylation targets of the mTOR pathway were all mutated to alanines (4EBPμ). All vectors expressed a colinear neomycin selection marker. Plates were each seeded with 10,000 cells and maintained in G418 selection. Shown are the crystal violet–stained dishes after 2 wk of colony growth. B, eIF4E enhanced colony formation when cotransfected with max. Rat1A cells were transfected with a control plasmid (Control) or a plasmid expressing max (Max) in the absence or presence of a vector expressing eIF4E (control or eIF4E). Transfections were done as in A except that dual hygromycin and G418 selection were applied. After 3 wk, colonies were stained with methylene blue. Western blots were done to evaluate expression of the transfected plasmids in pooled transfectants containing dual control vectors, max alone, eIF4E alone, or the combination of eIF4E and max. Shown are standards evaluated using the indicated antibodies. C, polysomal profile analysis of c-myc-null versus wild-type cells. Cells were grown in 100-mm plates and arrested by confluence followed by serum starvation for 48 h. Cells were >90% viable with this treatment as assessed by trypan blue exclusion. Cytoplasmic RNA was harvested and the lysates were centrifuged in sucrose gradients at 37,000 rpm to establish polysomal gradients. The gradients were harvested and A 260 was continuously monitored to evaluate the distribution of monosomal versus polysomal fractions. Shown are the profiles for arrested myc wild-type (black) and null (gray) cells showing a decreased polysomal fraction in myc-null cells. The region containing polysomes is indicated and the 40S, 60S, and 80S peaks are labeled. D, c-myc-null cells exhibit a diminished 40S/60S ratio in the monosomal fractions. Total absorbance in the 40S and 60S fractions were calculated by summing the area under each peak. Left, ratios of the 40S/60S peak fractions were determined for four separate experiments for each cell type (columns, mean; bars, SD). Myc-null cells also have less RNA in the polysomal fractions. Right, columns, mean total absorbance in the polysomal fractions calculated for four separate experiments for each cell type; bars, SD.
Figure 2
Figure 2
Restoration of Myc to myc-null cells alleviates their defect in translation initiation. A, myc-null cells are defective in translation initiation during serum induction. Cells were treated as in A, except that they were stimulated with 10% serum for 9 h before harvesting. Plots in gray are myc−/− and those in black are myc+/+. B and C, reintroduction of myc using retroviral transduction shows that the myc-null cell translation initiation defect is myc specific. B, myc-null cells transduced with an empty vector control virus (pBABE) or pBABE-myc (pMyc) were arrested and polysomal analysis was done as described in Fig. 1C. Plots in gray are myc−/− transfected with pBABE-Puro (pBABE) and plots in black are from myc−/− transfected with pBABE-myc. C, polysomal profiles were evaluated as in B, except that they were stimulated with 10% serum for 9 h before harvesting. Plots in gray are myc−/− transfected with pBABE-Puro and plots in black are from myc−/− transfected with pBABE-myc.
Figure 3
Figure 3
TSC2 expression is increased and other mTOR cascade components are altered in myc−/− cells. A, myc wild-type (lanes 1 and 2) and null (lanes 3 and 4) cells were grown as described in Materials and Methods. Immunoblot analysis was done on extracts of arrested cells (A) and after stimulation for 20 h with 10% (S). Eighty micrograms of whole-cell protein extracts from each sample were separated by SDS-PAGE and transferred electrophoretically onto nitrocellulose membranes. The membranes were probed with the indicated antibodies. Antibodies to phosphorylated forms of the proteins are labeled as α-P. The indicated molecular weights were identified with protein molecular weight size markers in each gel. TSC2 and IRS1 protein levels were higher in myc-null cells than in wild types in arrested and stimulated cells. Myc expression in wild-type cells supported higher levels of GβL, S6K, and rpS6, compared with their lower levels in null cells in arrested and stimulated cells. Rheb levels were somewhat different in arrested cells but not in serum-stimulated cells, so its expression patterns were not further evaluated in subsequent experiments. Importantly, lack of Myc in myc-null cells led to elevated tuberin levels. B, total levels of GβL, S6K, and rpS6 are induced by serum treatment of myc wild-type and null cells. Because the inducibility of S6K and rpS6 was unanticipated, we evaluated their levels at shorter time intervals after serum induction. Shown are protein levels at 1, 2, and 8 h after addition of serum for the indicated proteins using the indicated antibodies. C, genomic analysis of promoter regions of the mTOR pathway components for Myc binding sites. Reference cDNA sequences for human, rat, and mouse mTOR pathway gene products were identified using the NCBI sequence database. Genomic promoter sequences and transcription initiation sites were then identified as described in Materials and Methods (26). Five thousand nucleotides of sequence upstream and downstream of their transcription initiation sites were evaluated for Myc target sites that were conserved between human, rat, and mouse sequences in aligned regions using rVISTA (27). Nonconserved myc sites are designated as e boxes in the schematic diagram where the open rectangle identifies exon 1 of each of the candidate genes. Myc sites conserved in human, rat, and mouse promoters (top to bottom in each diagram) are identified as E boxes. The sequences of the conserved E boxes are provided in Supplementary Table S2, together with their position in the rat promoter relative to the transcription start site. D, chromatin immunoprecipitation (ChIP) analysis shows binding of tamoxifen-induced c-myc to the TSC2, GβL, and rpS6 promoters in mycER cells. Chromatin immunoprecipitation analysis with primers specific for rat TSC2, GβL, rpS6, and eIF4E promoters and anti–c-Myc antibodies was done on extracts from myc−/− mycER cells induced to express c-myc after 3 h of treatment with 200 nmol/L tamoxifen. No Myc binding was detected in the absence of tamoxifen treatment (not shown). Primers for the rat 5S RNA promoter were used in parallel as an internal loading control for input DNA and the data were normalized to the 5S signals. The difference between tamoxifen induced and noninduced was significant by t test for TSC2 (P = 0.0043) and for rpS6 (P = 0.0005). The GβL differences were not significant.
Figure 4
Figure 4
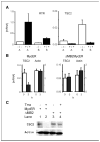
Myc directly represses TSC2 mRNA levels. A, steady-state levels of TSC2 mRNAs are increased in myc-null compared with wild-type cells. Cells were arrested by confluence followed by serum starvation for 48 h (A) or stimulated to reenter the cell cycle with 10% FBS (S). Treated cells were harvested for total RNA at 9 h. Total RNA (0.5 μg) was subjected to reverse transcriptase reactions using oligo-dT primers, and the resulting cDNAs were analyzed by quantitative real-time PCR (qrt-PCR) compared with standardized quantities of gene-specific PCR products generated with gene-specific primers. Equivalent amounts of cDNA from the same reverse transcription reactions were analyzed by quantitative PCR with standardized quantities of β-actin PCR product using primers specific for β-actin. The results are expressed as the absolute quantity of each mRNA species, normalized for their actin levels, which is then plotted along the y axis. The genotypes of the cells used are indicated as myc-null (−/−) or wild-type (+/+) along the x axis. The differences between wild-type and myc-null TSC2 levels were significant by t test in arrested (A; P = 0.038) and stimulated (S; P = 0.050) cells. B and C, Myc down-regulates TSC2 gene expression in a myc box II–dependent manner. B, induction of c-myc down-regulates TSC2 mRNA in myc−/− cells expressing a mycERtmx construct but not in ΔMBII-mycER cells. Total RNA was harvested from noninduced cells (0 h) or cells induced to express c-mycER or mutant mycER after 3-h treatment with 200 nmol/L tamoxifen (3 h), reverse transcribed, and analyzed by quantitative real-time PCR as in A. The difference between uninduced and induced TSC2 levels were significant in the mycERtmx cells (P = 0.0004). C, induction of conditional myc reduces tuberin protein levels. Tuberin protein levels were monitored in the mycER constructs treated as in B, except that protein lysates were harvested and immunoblots for tuberin and actin were done.
Figure 5
Figure 5
Inhibition of TSC2 expression restores S6K activation in myc-null cells, and TSC2 is regulated by c-myc in HL60 cells. A, TSC2 siRNA stimulates phosphorylation of S6K and rpS6 in myc−/− cells. Myc-null (myc−/−) cells were transiently transfected with 10 or 50 nmol/L siRNA for TSC2 (T) or with firefly luciferase siRNA (L) as a negative control. Levels of tuberin, phosphorylated S6K (p-S6K) protein, and phosphorylated rpS6 (p-rpS6) were analyzed by immunoblotting 72 h after transfection in confluent transfected cells. B, steady-state TSC2 protein is up-regulated in HL60 cells induced to differentiate with TPA. HL60 cells were given fresh medium and treated with TPA (20 nmol/L) or left untreated. After 48 h, untreated suspension cells were harvested by centrifugation, whereas TPA-treated differentiated cells were scraped from the bottom of the flask. Whole-cell protein extracts were separated by PAGE and probed for TSC2 and β-actin. As expected, a Northern blot shows that the PMA-induced loss of myc mRNA was complete in the differentiated HL60 cells. C, steady-state TSC2 mRNA is increased in HL60 cells induced to differentiate with TPA. HL60 cells were treated and harvested as in B, except that total RNA was extracted, subjected to reverse transcription, and analyzed by quantitative real-time PCR with primers specific to TSC2. Results are normalized to β-actin. D, Myc-specific shRNAs induce tuberin in HL60 cells. HL60 cells were infected with retroviral constructs expressing shRNAs for c-myc [NM_002467.2-1828slcl (28), NM_002467.2-1657slcl (57), and NM_002467-pooled (Po) shRNAs] and a negative control scrambled construct (Sc). Ten days after puromycin selection for the retroviral vectors was initiated immunoblots for tuberin, Myc and actin analyses were done using lysates from 3 × 10⁴ cells per lane.
Figure 6
Figure 6
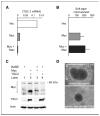
Exogenous Myc inhibits TSC2 mRNA expression and TSC2 blocks Myc-induced large colony formation of Rat1A cells in soft agar. A, transforming levels of c-myc inhibit TSC2 mRNA expression. Total RNA was harvested from confluent cultures of stable cell lines expressing a control vector, myc, and the combination of myc and max and subjected to reverse transcription followed by quantitative real-time PCR with primers specific for TSC2. Results are normalized to β-actin. B, myc transformation of Rat1A cells in soft agar assays. Plotted is the fold change in cells per well for six wells each in four separate repetitions of the experiment comparing transfected constructs to vector control cells for each repetition [columns, mean (n = 24 for each plot); bars, SE]. C, retroviral-mediated expression of myc and/or TSC2 in Rat1A cells. Rat1A cells were sequentially infected in pairs with retroviral constructs containing empty pBABE vector and pBABE-myc, or pBABE and pBABE-TSC2, or pBABE-TSC2 and pBABE-myc, or two rounds of retrovirus containing pBABE vector alone, and then stably selected in puromycin (8 μg/mL). Expression of c-myc and TSC2 proteins from cells in confluent cultures was assessed by immunoblotting. D, TSC2 blocks Myc-induced large colony formation of Rat1A cells grown in soft agar. Top, Rat1A cells transduced with pBABE-Myc were evaluated after growth in soft agar for 2 wk. Bottom, Rat1A cells transduced with pBABE-TSC2 in combination with pBABE-Myc were evaluated after growth in soft agar for 2 wk.

Similar articles

Cited by

References

    1. Baserga R. The biology of cell reproduction. Cambridge (MA): Harvard University Press; 1985.
    1. Hahn WC, Dessain SK, Brooks MW, et al. Enumeration of the simian virus 40 early region elements necessary for human cell transformation. Mol Cell Biol. 2002;22:2111–23. - PMC - PubMed
    1. Sonenberg N, Hershey JWB, Mathews M, editors. Translational control of gene expression. 2. Cold Spring Harbor (NY): Cold Spring Harbor Laboratory Press; 2000.
    1. Hay N, Sonenberg N. Upstream and downstream of mTOR. Genes Dev. 2004;18:1926–45. - PubMed
    1. Jones RM, Branda J, Johnston KA, et al. An essential E box in the promoter of the gene encoding the mRNA cap-binding protein (eukaryotic initiation factor 4E) is a target for activation by c-myc. Mol Cell Biol. 1996;16:4754–64. - PMC - PubMed

Publication types

MeSH terms

LinkOut - more resources