An androgen-regulated miRNA suppresses Bak1 expression and induces androgen-independent growth of prostate cancer cells
- PMID: 18056640
- PMCID: PMC2148409
- DOI: 10.1073/pnas.0706641104
An androgen-regulated miRNA suppresses Bak1 expression and induces androgen-independent growth of prostate cancer cells
Abstract
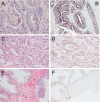
Although prostate cancer (CaP) is the most frequently diagnosed malignant tumor and the second leading cause of cancer deaths in American men, the mechanisms explaining the development and progression of CaP remain largely unknown. Recent studies have shown that some aberrantly expressed microRNAs (miRNAs) are involved in tumorigenesis. Although aberrant expression of certain miRNAs has been discovered in CaP, their function in this disease has not yet been defined. In this study, we found differential expression of miR-125b in androgen-dependent and independent CaP cells, as well as in benign and malignant prostate tissues. Furthermore, androgen signaling was able to up-regulate the expression of miR-125b. In addition, transfection of synthetic miR-125b stimulated androgen-independent growth of CaP cells and down-regulated the expression of Bak1. Our results suggest that miR-125b acts as an oncogene, contributing to the pathogenesis of CaP.
Conflict of interest statement
The authors declare no conflict of interest.
Figures


Similar articles
-
MicroRNAs and prostate cancer.J Cell Mol Med. 2008 Sep-Oct;12(5A):1456-65. doi: 10.1111/j.1582-4934.2008.00420.x. Epub 2008 Jul 8. J Cell Mol Med. 2008. PMID: 18624768 Free PMC article. Review.
-
miR-125b promotes growth of prostate cancer xenograft tumor through targeting pro-apoptotic genes.Prostate. 2011 Apr;71(5):538-49. doi: 10.1002/pros.21270. Epub 2010 Sep 30. Prostate. 2011. PMID: 20886540 Free PMC article.
-
MicroRNA-125b confers the resistance of breast cancer cells to paclitaxel through suppression of pro-apoptotic Bcl-2 antagonist killer 1 (Bak1) expression.J Biol Chem. 2010 Jul 9;285(28):21496-507. doi: 10.1074/jbc.M109.083337. Epub 2010 May 11. J Biol Chem. 2010. PMID: 20460378 Free PMC article.
-
MicroRNAs and their potential for translation in prostate cancer.Urol Oncol. 2009 May-Jun;27(3):307-11. doi: 10.1016/j.urolonc.2009.01.004. Urol Oncol. 2009. PMID: 19414119 Free PMC article.
-
[The role of miRNAs in androgen-independent progression of prostate cancer].Zhonghua Nan Ke Xue. 2013 Sep;19(9):831-4. Zhonghua Nan Ke Xue. 2013. PMID: 24386864 Review. Chinese.
Cited by
-
A restricted signature of serum miRNAs distinguishes glioblastoma from lower grade gliomas.J Exp Clin Cancer Res. 2016 Jul 30;35(1):124. doi: 10.1186/s13046-016-0393-0. J Exp Clin Cancer Res. 2016. PMID: 27476114 Free PMC article.
-
MicroRNAs take part in pathophysiology and pathogenesis of Male Pattern Baldness.Mol Biol Rep. 2010 Jul;37(6):2959-65. doi: 10.1007/s11033-009-9862-2. Epub 2009 Oct 10. Mol Biol Rep. 2010. PMID: 19821055
-
Identification and characterization of miRNAs expressed in the bovine ovary.BMC Genomics. 2009 Sep 18;10:443. doi: 10.1186/1471-2164-10-443. BMC Genomics. 2009. PMID: 19765282 Free PMC article.
-
The role and significance of magnetic resonance imaging and miRNA-125b expression level in diagnosis of head and neck squamous cell carcinoma.Postepy Dermatol Alergol. 2022 Feb;39(1):110-115. doi: 10.5114/ada.2021.104701. Epub 2021 Oct 25. Postepy Dermatol Alergol. 2022. PMID: 35369634 Free PMC article.
-
Stress-induced ECM alteration modulates cellular microRNAs that feedback to readjust the extracellular environment and cell behavior.Front Genet. 2013 Dec 31;4:305. doi: 10.3389/fgene.2013.00305. Front Genet. 2013. PMID: 24427166 Free PMC article. Review.
References
-
- Jemal A, Siegel R, Ward E, Murray T, Xu J, Thun MJ. CA Cancer J Clin. 2007;57:43–66. - PubMed
-
- Santos AF, Huang H, Tindall DJ. Steroids. 2004;69:79–85. - PubMed
-
- Abdulkadir SA. Ann NY Acad Sci. 2005;1059:33–40. - PubMed
-
- Downing SR, Russell PJ, Jackson P. Can J Urol. 2003;10:1924–1933. - PubMed
-
- Sharifi N, Farrar WL. Am J Ther. 2006;13:166–170. - PubMed
Publication types
MeSH terms
Substances
Grants and funding
LinkOut - more resources
Full Text Sources
Other Literature Sources
Medical
Miscellaneous

