Comparative Study
. 2007 Dec 5;27(49):13420-9.
doi: 10.1523/JNEUROSCI.1709-07.2007.

Differential gating and recruitment of P/Q-, N-, and R-type Ca2+ channels in hippocampal mossy fiber boutons

Affiliations
Comparative Study

Differential gating and recruitment of P/Q-, N-, and R-type Ca2+ channels in hippocampal mossy fiber boutons

Liyi Li et al. J Neurosci. .

Abstract

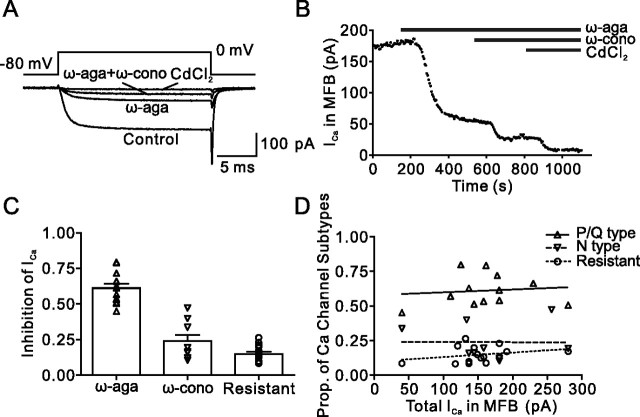
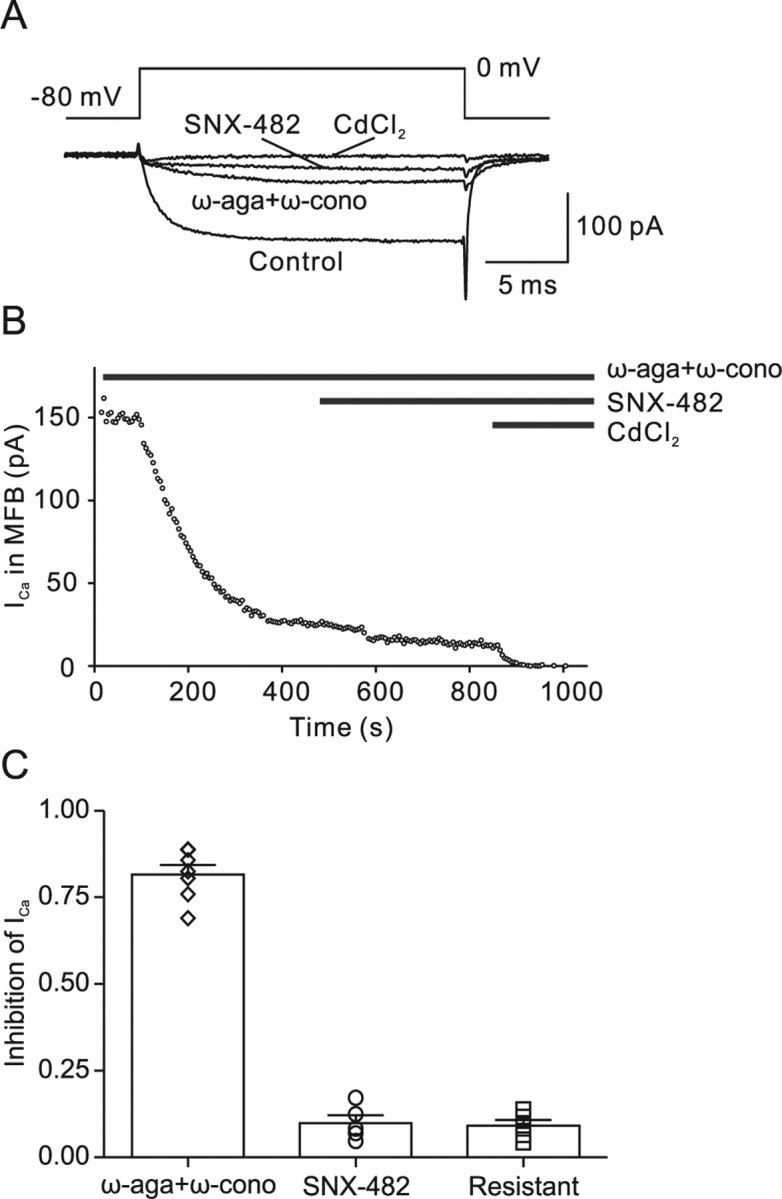
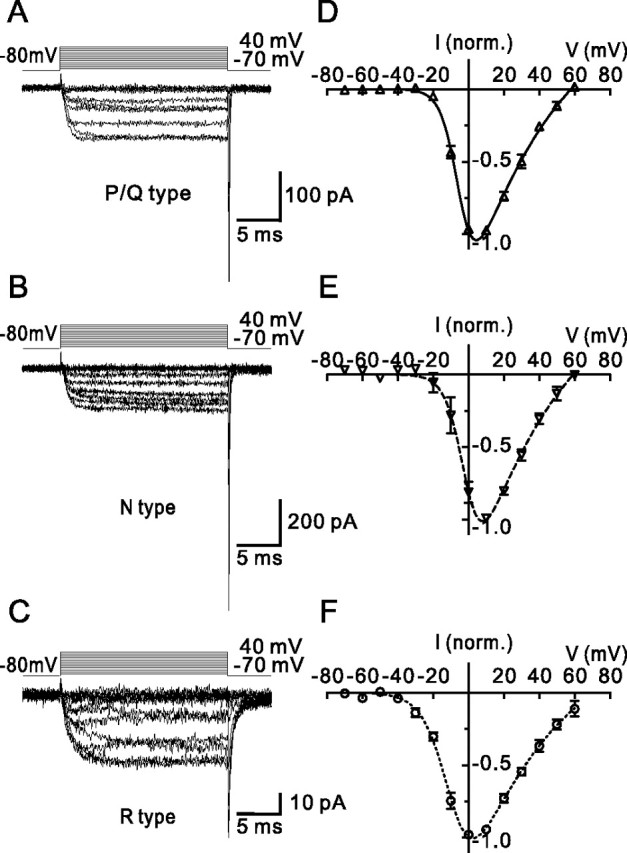
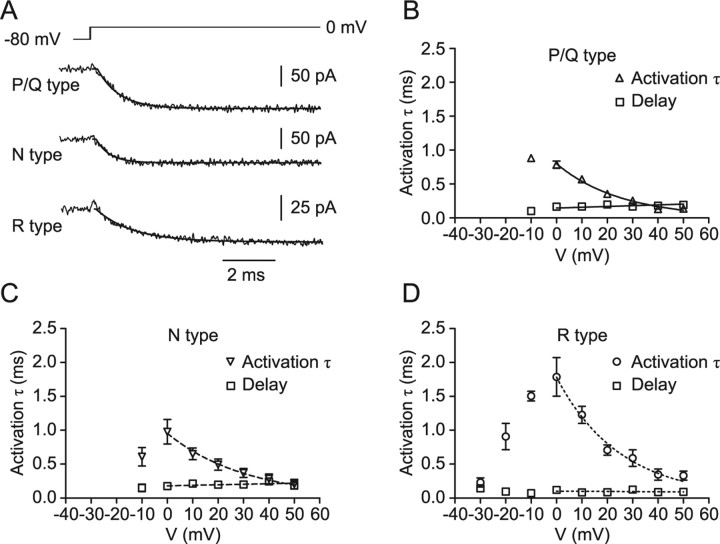
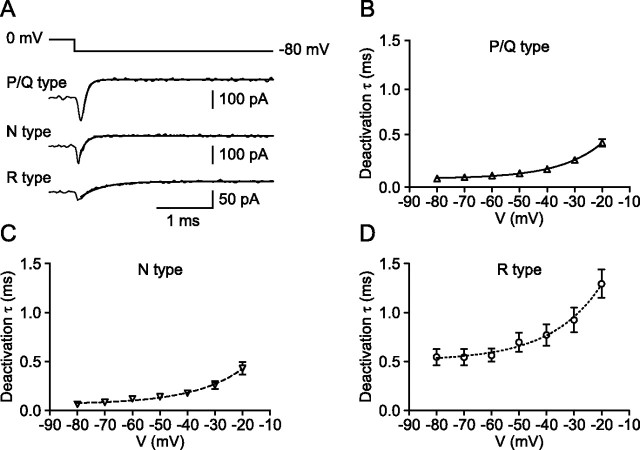
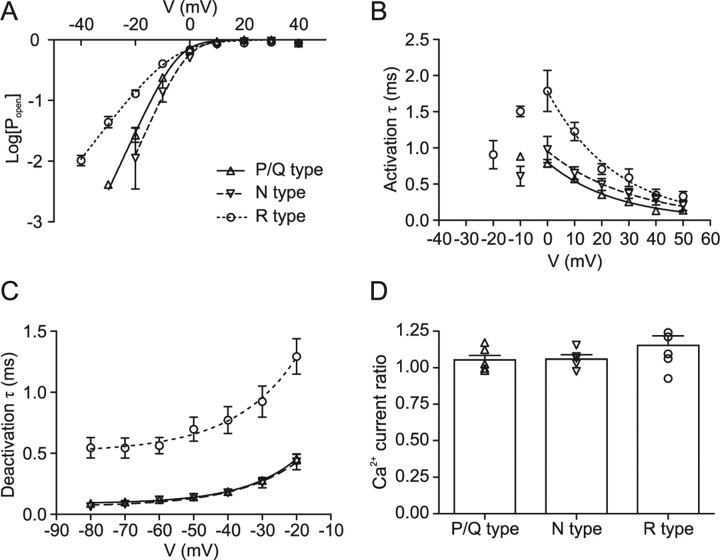
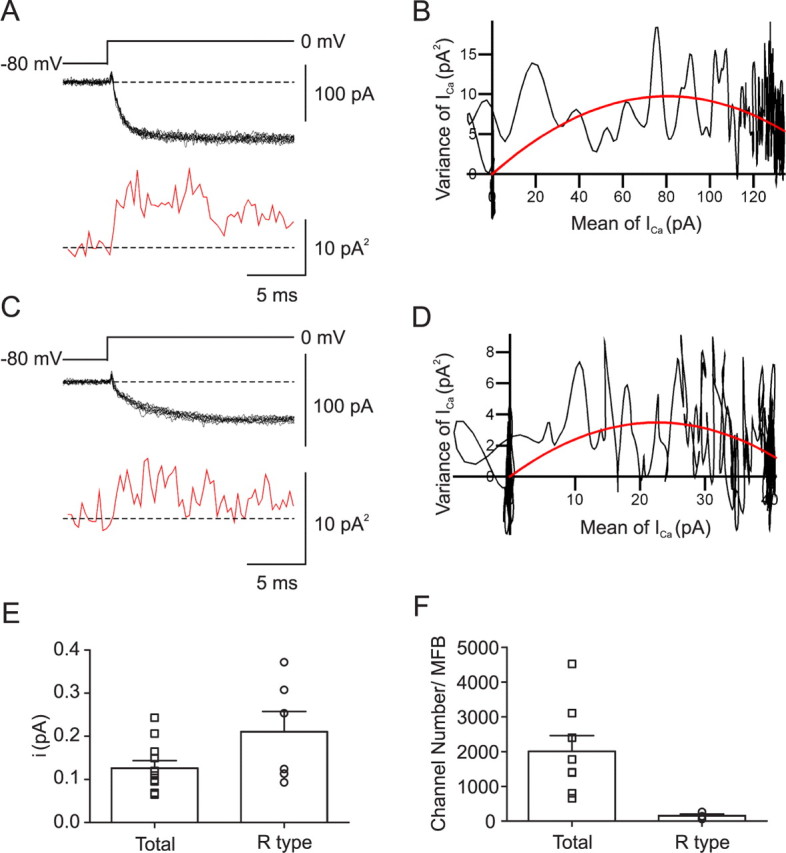
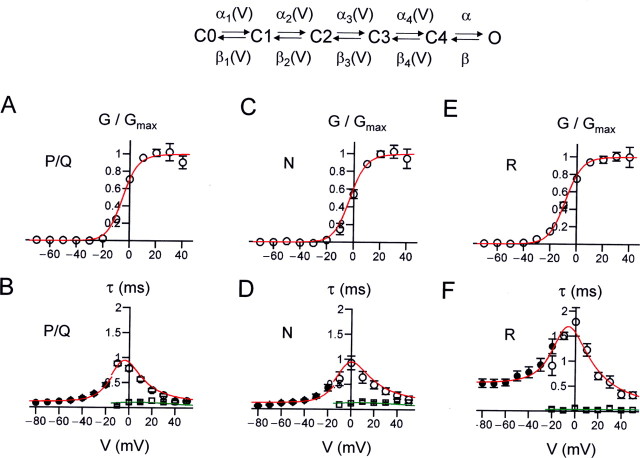
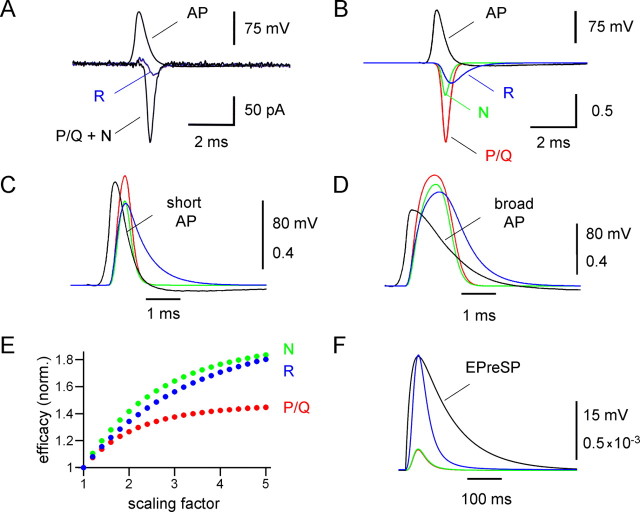
Voltage-gated Ca2+ channels in presynaptic terminals initiate the Ca2+ inflow necessary for transmitter release. At a variety of synapses, multiple Ca2+ channel subtypes are involved in synaptic transmission and plasticity. However, it is unknown whether presynaptic Ca2+ channels differ in gating properties and whether they are differentially activated by action potentials or subthreshold voltage signals. We examined Ca2+ channels in hippocampal mossy fiber boutons (MFBs) by presynaptic recording, using the selective blockers omega-agatoxin IVa, omega-conotoxin GVIa, and SNX-482 to separate P/Q-, N-, and R-type components. Nonstationary fluctuation analysis combined with blocker application revealed a single MFB contained on average approximately 2000 channels, with 66% P/Q-, 26% N-, and 8% R-type channels. Whereas both P/Q-type and N-type Ca2+ channels showed high activation threshold and rapid activation and deactivation, R-type Ca2+ channels had a lower activation threshold and slower gating kinetics. To determine the efficacy of activation of different Ca2+ channel subtypes by physiologically relevant voltage waveforms, a six-state gating model reproducing the experimental observations was developed. Action potentials activated P/Q-type Ca2+ channels with high efficacy, whereas N- and R-type channels were activated less efficiently. Action potential broadening selectively recruited N- and R-type channels, leading to an equalization of the efficacy of channel activation. In contrast, subthreshold presynaptic events activated R-type channels more efficiently than P/Q- or N-type channels. In conclusion, single MFBs coexpress multiple types of Ca2+ channels, which are activated differentially by subthreshold and suprathreshold presynaptic voltage signals.


Figures

Figure 1.
Figure 1.
Pharmacological dissection reveals three components of the presynaptic Ca2+ current in hippocampal MFBs. A, Presynaptic Ca2+ current evoked by a 20 ms pulse to 0 mV under control conditions, in the presence of 500 nm ω-agatoxin IVa (ω-aga), and after subsequent addition of 1 μm ω-conotoxin GVIa (ω-cono). The residual component was blocked by 200 μm Cd2+, confirming that it was mediated by Ca2+ channels. B, Plot of Ca2+ current amplitude against time during application of the toxins. The time of application of the blockers is indicated by the horizontal bars. Same bouton as shown in A. C, Summary bar graph illustrating the proportions of ω-agatoxin IVa-sensitive, ω-conotoxin GVIa-sensitive, and toxin-resistant component of the Ca2+ current. Symbols (triangles, inverted triangles, and circles) represent individual experiments, and bars represent mean ± SEM. Data are from 12, 9, and 15 boutons. D, Plot of the proportions (Prop.) of the three components against the total Ca2+ current amplitude. Note the lack of correlation (Pearson's r, 0.11, −0.01, and 0.28; p > 0.2 in all cases).
Figure 2.
Figure 2.
The agatoxin/conotoxin-resistant Ca2+ current component is primarily mediated by R-type channels. A, Presynaptic Ca2+ current evoked by a 20 ms pulse to 0 mV under control conditions, in the presence of 500 nm ω-agatoxin IVa (ω-aga) + 1 μm ω-conotoxin GVIa (ω-cono), and after subsequent addition of 500 nm SNX-482. The residual component was completely blocked by 200 μm Cd2+, confirming that it was mediated by Ca2+ channels. B, Plot of Ca2+ current amplitude against time during application of the toxins. The time of application of the blockers is indicated by the horizontal bars. C, Summary bar graph illustrating the proportions of ω-agatoxin IVa + ω-conotoxin GVIa-sensitive, SNX-482-sensitive, and toxin-resistant component of the Ca2+ current. Symbols (diamonds, circles, and squares) represent individual experiments, and bars represent mean ± SEM. Data are from seven, five, and five boutons.
Figure 3.
Figure 3.
Voltage dependence of activation of P/Q-, N-, and R-type components of the presynaptic Ca2+ current. A–C, Single traces of P/Q-type (A), N-type (B), and R-type (C) components of the presynaptic Ca2+ current obtained by pharmacological isolation and digital subtraction. Pulse protocol: holding potential −80 mV, test pulses to between −70 mV and +40 mV (10 mV increment), and step back to −80 mV. Traces in A–C are from three different boutons. D–F, Average current–voltage relations of the three components. Current amplitudes were measured at the end of the 20 ms pulses and normalized (norm.) to the amplitude at 10 mV (D, E) or 0 mV (F). Data points were fitted with Equation 2 (continuous, dashed, and dotted curves). Data are from six, five, and six boutons.
Figure 4.
Figure 4.
Activation kinetics of presynaptic P/Q-, N-, and R-type Ca2+ channels. A, Traces of P/Q- (top trace), N- (center trace), and R- (bottom trace) type components of the presynaptic Ca2+ current obtained by pharmacological isolation and digital subtraction. Pulse protocol: holding potential −80 mV, test pulse to 0 mV. Traces were fitted with Equation 1 (continuous lines). B–D, Activation time constant (inverted triangles, triangles, and circles) and delay (squares) for P/Q- (B), N- (C), and R- (D) type components. Time constant values for voltages ≥0 mV were fitted with exponential functions, and delay values were fitted by linear regression. Data are from five, five, and seven boutons.
Figure 5.
Figure 5.
Deactivation kinetics of presynaptic P/Q-, N-, and R-type Ca2+ channels. A, Traces of P/Q- (top trace), N- (center trace), and R- (bottom trace) type components of the presynaptic Ca2+ current obtained by pharmacological isolation and digital subtraction. Pulse protocol: holding potential −80 mV, 20 ms test pulse to 0 mV, and step back to −80 mV. Traces were fitted with an exponential function (continuous line). B–D, Deactivation time constant for P/Q- (B), N- (C), and R- (D) type components. Data points were fitted with exponential functions. Data are from five, four, and seven boutons.
Figure 6.
Figure 6.
Summary of gating properties of presynaptic P/Q-, N-, and R-type channels. A, Semilogarithmic plot of steady-state activation curve of P/Q- (triangles), N- (inverted triangles), and R- (circles) type components. The Popen–V relations were obtained from the I–V relations by dividing the current by the Goldman-Hodgkin-Katz factor in Equation 2, with values of P, C, and D taken from the fit of I–Vs. Note that the activation curves of P/Q and N-type component are very similar, whereas the activation curve of the R-type component is less steep. B, Plot of activation time constant against voltage. C, Plot of deactivation time constant against voltage. Note that both activation and deactivation time constants are similar for P/Q- and N-type components, but slower for the R-type component. Data points in A were fitted with logarithmic Boltzmann functions, and data points in B and C were fitted by exponential functions (for voltages ≥0 mV in B; continuous, dashed, and dotted curves). D, Summary bar graph of ratio of Ca2+ current at the end (15–20 ms) and the beginning (5–10 ms) of 20 ms pulses to 0 mV for P/Q-, N-, and R-type components. In all cases, the ratio is close to 1, indicating the lack of inactivation.
Figure 7.
Figure 7.
Single-channel conductance and number of Ca2+ channels in hippocampal MFBs. A, C, 10 consecutive traces of Ca2+ currents evoked by steps from −80 to 0 mV (black traces) and mean variance calculated from 15 adjacent points (red trace) under control conditions (A) and in the presence of 500 nm ω-agatoxin IVa + 1 μm ω-conotoxin GVIa (C). B, D, Plot of variance against mean under control conditions (B) and in the presence of 500 nm ω-agatoxin IVa + 1 μm ω-conotoxin GVIa (D). Data were fitted by Equation 3 (red curve). Baseline noise was subtracted. The single-channel current and the total number of channels were 0.24 pA and 664 under control conditions (B) and 0.31 pA and 148 in the presence of ω-agatoxin IVa + ω-conotoxin GVIa (D). Data in A and B were obtained from a different bouton from those in C and D. E, Summary bar graph of single-channel current (i) in control conditions and in the presence of ω-agatoxin IVa + ω-conotoxin GVIa. F, Summary bar graph of number of channels per MFB in control conditions and in the presence of ω-agatoxin IVa + ω-conotoxin GVIa.
Figure 8.
Figure 8.
Gating models for presynaptic P/Q-, N-, and R-type channels. A, B, Modeling of voltage dependence of steady-state activation (A, open circles), activation time constant (B, open circles), delay (B, open squares), and deactivation time constant (B, filled circles) for presynaptic P/Q-type channels. C–F, Similar analysis for N-type (C, D) and R-type channels (E, F). The scheme on top indicates the structure of the kinetic model. The predictions of the models are indicated by red (activation curve, activation time constant, deactivation time constant) and green curves (delays). For model parameters, see Table 2.
Figure 9.
Figure 9.
Efficacy of Ca2+ channel activation by natural presynaptic voltage waveforms. A, Contribution of P/Q-, N-, and R-type channels to the Ca2+ current evoked by a short action potential (AP) in a whole-cell recorded MFB. Top traces, action potentials used as voltage-clamp commands. Bottom traces, Ca2+ currents evoked by the stimulus waveform under control conditions and in the presence of 500 nm ω-agatoxin IVa + 1 μm ω-conotoxin GVIa. B, Simulated Ca2+ currents carried by P/Q-type channels (red curve), N-type channels (green curve), and R-type channels (blue curve) during a short action potential. C, D, Open probability of P/Q-type channels (red curves), N-type channels (green curves), and R-type channels (blue curves), during short (C) and broadened (D) action potential waveforms (black curves). Broadened action potentials were generated by scaling of the repolarization phase in time by a factor of three. E, Plot of peak efficacy of Ca2+ channel activation against the scaling factor, normalized (norm.) to the peak efficacy obtained with the unscaled action potential. For P/Q-type Ca2+ channels (red circles), the efficacy increased only moderately, whereas for N- (green circles) and R-type Ca2+ channels (blue circles) the efficacy increased substantially as the action potential was prolonged. F, Open probability of P/Q-type channels (red curves), N-type channels (green curves), and R-type channels (blue curves), during a subthreshold depolarization with slow exponential rise and decay (rise time constant 20 ms, decay time constant 100 ms), approximating the shape of previously recorded EPreSPs in MFBs (Alle and Geiger, 2006).

References

    1. Acsády L, Kamondi A, Sík A, Freund T, Buzsáki G. GABAergic cells are the major postsynaptic targets of mossy fibers in the rat hippocampus. J Neurosci. 1998;18:3386–3403. - PMC - PubMed
    1. Alle H, Geiger JRP. Combined analog and action potential coding in hippocampal mossy fibers. Science. 2006;311:1290–1293. - PubMed
    1. Arikkath J, Campbell KP. Auxiliary subunits: essential components of the voltage-gated calcium channel complex. Curr Opin Neurobiol. 2003;13:298–307. - PubMed
    1. Augustine GJ, Charlton MP, Smith SJ. Calcium entry into voltage-clamped presynaptic terminals of squid. J Physiol (Lond) 1985;367:143–162. - PMC - PubMed
    1. Awatramani GB, Price GD, Trussell LO. Modulation of transmitter release by presynaptic resting potential and background calcium levels. Neuron. 2005;48:109–121. - PubMed

Publication types

MeSH terms

LinkOut - more resources