Comparative Study
. 2007 Dec 5;27(49):13513-9.
doi: 10.1523/JNEUROSCI.3005-07.2007.

The source of afterdischarge activity in neocortical tonic-clonic epilepsy

Affiliations
Comparative Study

The source of afterdischarge activity in neocortical tonic-clonic epilepsy

Andrew J Trevelyan et al. J Neurosci. .

Abstract

Tonic-clonic seizures represent a common pattern of epileptic discharges, yet the relationship between the various phases of the seizure remains obscure. Here we contrast propagation of the ictal wavefront with the propagation of individual discharges in the clonic phase of the event. In an in vitro model of tonic-clonic epilepsy, the afterdischarges (clonic phase) propagate with relative uniform speed and are independent of the speed of the ictal wavefront (tonic phase). For slowly propagating ictal wavefronts, the source of the afterdischarges, relative to a given recording electrode, switched as the wavefront passed by, indicating that afterdischarges are seeded from wavefront itself. In tissue that has experienced repeated ictal events, the wavefront generalizes rapidly, and the afterdischarges in this case show a different "flip-flop" pattern, with frequent switches in their direction of propagation. This same flip-flop pattern is also seen in subdural EEG recordings in patients suffering intractable focal seizures caused by cortical dysplasias. Thus, in both slowly and rapidly generalizing ictal events, there is not a single source of afterdischarge activity: rather, the source is continuously changing. Our data suggest a complex view of seizures in which the ictal event and its constituent discharges originate from distinct locations.


Conflict of interest statement

Conflict of interest statement: The authors declare no competing financial interests.

Figures

Figure 1.
Figure 1.
Highly uniform propagation speed of afterdischarges. A, Paired Vclamp recording (at −30 mV) of two layer 5 pyramidal cells (485 μm separation) during an ictal event. Bottom, An enlarged view of the after discharges. B, Examples of afterdischarges recorded in pairs of layer 5 pyramidal cells at the separations indicated. There is a steady increase in the delay with increasing separation of the recorded pyramidal cells. C, To quantify this, we derived cross-correlograms for the traces: a peak exactly at zero indicates simultaneous events, whereas deviations from zero in the peak give the temporal delay. The cross-correlograms for the raw traces and for the first temporal derivatives gave the same peak location. D, The temporal delays measured this way showed an extremely high correlation with the separation of the recorded cells. The gradient of this plot suggests the propagation speed of the afterdischarges to be ∼27 mm/s.
Figure 2.
Figure 2.
The velocity of the ictal wavefront and the afterdischarge are independently set. A, The speed of afterdischarges does not change with successive ictal events, unlike the speed of the ictal wavefront, which increases with each successive event [data for the ictal wavefront is from Trevelyan et al. (2007), shown here for comparison]. B, The speed of the ictal wavefront plotted against the speed of subsequent afterdischarges for the same ictal event (n = 44 events from 12 slices). The delays are normalized to the separation of the recording electrodes so as not to bias the dataset by a skewed sample of electrode separations. The speed of the ictal wavefront and the discharges are not correlated.
Figure 3.
Figure 3.
The late afterdischarges propagate in the opposite direction to the main ictal wavefront. A, Photomicrograph of the three recorded layer 5 pyramidal cells. Cell separations: black to red, 500 μm; red to blue, 820 μm. B, Vclamp recordings from three layer 5 pyramidal cells during the first ictal event to propagate in the slice. The ictal event propagates from black to red to blue. The afterdischarges, however, propagate in the opposite direction. C, The second ictal event recorded in this slice happened to propagate in the opposite direction; all activity developed spontaneously. Remarkably, the afterdischarges also switched direction. Thus, the afterdischarges consistently propagated in the opposite direction to the ictal wavefront.
Figure 4.
Figure 4.
The direction of the discharges reverses as the wavefront passes the recorded cell. A, Paired voltage-clamp recording from pyramidal cells (separation, 610 μm) during an early, slowly propagating ictal event. The earliest discharges spread from the red to the black cell and are thus propagating in the direction of the ictal wavefront. The direction of the discharge propagation subsequently reverses so that the later afterdischarges propagate backward from the black to the red cell. The relative timing of the discharges is shown in the plot below the Vclamp traces and shows clearly that the discharges reverse their direction as the synaptic barrage reaches its greatest intensity in the later recruited cell. Positive values indicate that the discharge propagates in the same direction as the ictal wavefront, whereas negative values represent discharges propagating in the opposite direction to the main wavefront. B, Pooled data from eight paired recordings (12 ictal events), aligned by the peak filtered inward current in the later recruited of the two cells. The top plot shows low-pass-filtered (0.2 Hz) Vclamp recordings during slowly propagating ictal events. Each recording is one of a pair of Vclamp recordings and shows the later of the two cells to be recruited. The minima in these filtered plots accurately reflect the peak intensity of the synaptic barrage (for an overlay of the raw Vclamp trace and the low-pass-filtered version, see supplemental Fig. 1, available at www.jneurosci.org as supplemental material). The bottom plot shows the mean discharge latency in the pairs of recorded cells, normalized to a cell separation of 1 mm. The plot has the same convention as in Figure 3 (positive, same direction as ictal wavefront; negative, opposite direction). C, Schematic to show the typical pattern of activity flow during a slowly propagating ictal event. This figure is adapted from Trevelyan et al. (2006) and shows a line scan through a cortical slice that had been bulk loaded with the Ca2+ dye Oregon Green BAPTA 1. The ordinate represents distance, and the abscissa represents time. The line scan shows a slowly propagating ictal event, and the wavefront is outlined by the dotted red line. Our analysis of the timing of discharges, presented here, indicates that all activity originates in this narrow propagating band of tissue and spreads both forward, to recruit more tissue to the event, and backward, in the form of afterdischarges.
Figure 5.
Figure 5.
Frequent switches in the direction of propagation of individual discharges after many ictal events. A, Paired Vclamp recordings of separate layer 5 pyramidal cells in a slice that has experienced many previous ictal events. The ictal event rapidly generalizes, as evident by the almost synchronous initial excitatory volley in the two cells. The bottom shows the relative timing of individual discharges and, as is typical for these rapidly generalizing events, shows that discharges switch directions frequently. B, Line scan schematic to illustrate that, in rapidly generalizing events, there are regular switches in the direction that afterdischarges propagate. It should be noted that the directionality of afterdischarges cannot be determined from our Ca2+ imaging dataset because the afterdischarges traverse the entire field of view within a single time frame: the arrows are merely a heuristic aid. C, Afterdischarge pattern recorded from two subdural electrodes (separated by ∼3 cm) in a patient with intractable seizures caused by a focal cortical dysplasia. Although in this patient the source of the seizure activity was clearly localized, the afterdischarges show frequent switches in the direction of propagation.
Figure 6.
Figure 6.
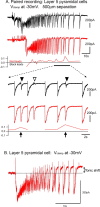
Failure of backpropagating afterdischarges. A, Simultaneous Vclamp recordings of two layer 5 pyramidal cells, during a slowly propagating ictal event. Toward the end of the clonic phase, there are several examples of discharges failing to propagate back toward the cell that has been active for the longest time. An expanded view of these recordings is shown below. Note that the partial failures (filled arrowheads) are associated with an increase in latency (arrows). There is a break in the delay plot for the event that fails to propagate, because the cross-correlation at this time was meaningless. B, Vclamp recording of a layer 5 pyramidal cells, held at −30 mV, to show a consistent feature of these recordings: the upwards shift in the baseline current during the afterdischarge phase of the ictal event (tonic shift).

Comment in

Similar articles

Cited by

References

    1. Alarcon G, Guy CN, Binnie CD, Walker SR, Elwes RD, Polkey CE. Intracerebral propagation of interictal activity in partial epilepsy: implications for source localisation. J Neurol Neurosurg Psychiatry. 1994;57:435–449. - PMC - PubMed
    1. Alarcon G, Garcia Seoane JJ, Binnie CD, Martin Miguel MC, Juler J, Polkey CE, Elwes RD, Ortiz Blasco JM. Origin and propagation of interictal discharges in the acute electrocorticogram. Implications for pathophysiology and surgical treatment of temporal lobe epilepsy. Brain. 1997;120:2259–2282. - PubMed
    1. Albowitz B, Kuhnt U. Epileptiform activity in the guinea-pig neocortical slice spreads preferentially along supragranular layers—recordings with voltage-sensitive dyes. Eur J Neurosci. 1995;7:1273–1284. - PubMed
    1. Anderson WW, Lewis DV, Swartzwelder HS, Wilson WA. Magnesium-free medium activates seizure-like events in the rat hippocampal slice. Brain Res. 1986;398:215–219. - PubMed
    1. Bao W, Wu JY. Propagating wave and irregular dynamics: spatiotemporal patterns of cholinergic theta oscillations in neocortex in vitro. J Neurophysiol. 2003;90:333–341. - PMC - PubMed

Publication types

LinkOut - more resources