Comparative Study
. 2007 Dec 5;27(49):13520-31.
doi: 10.1523/JNEUROSCI.3151-07.2007.

Lack of synapsin I reduces the readily releasable pool of synaptic vesicles at central inhibitory synapses

Affiliations
Comparative Study

Lack of synapsin I reduces the readily releasable pool of synaptic vesicles at central inhibitory synapses

Pietro Baldelli et al. J Neurosci. .

Abstract

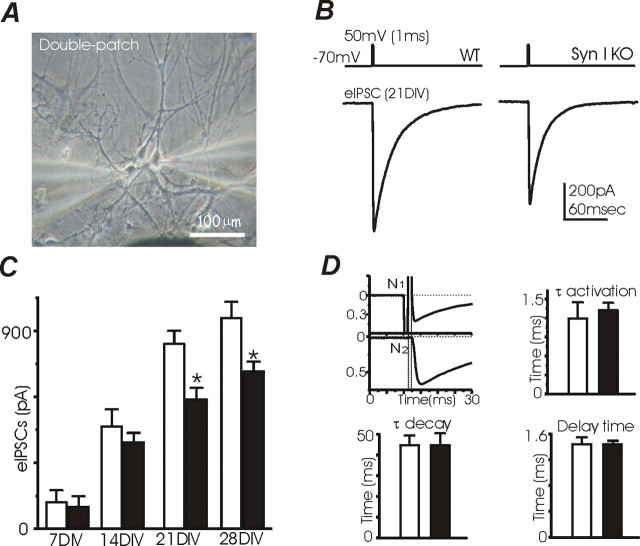
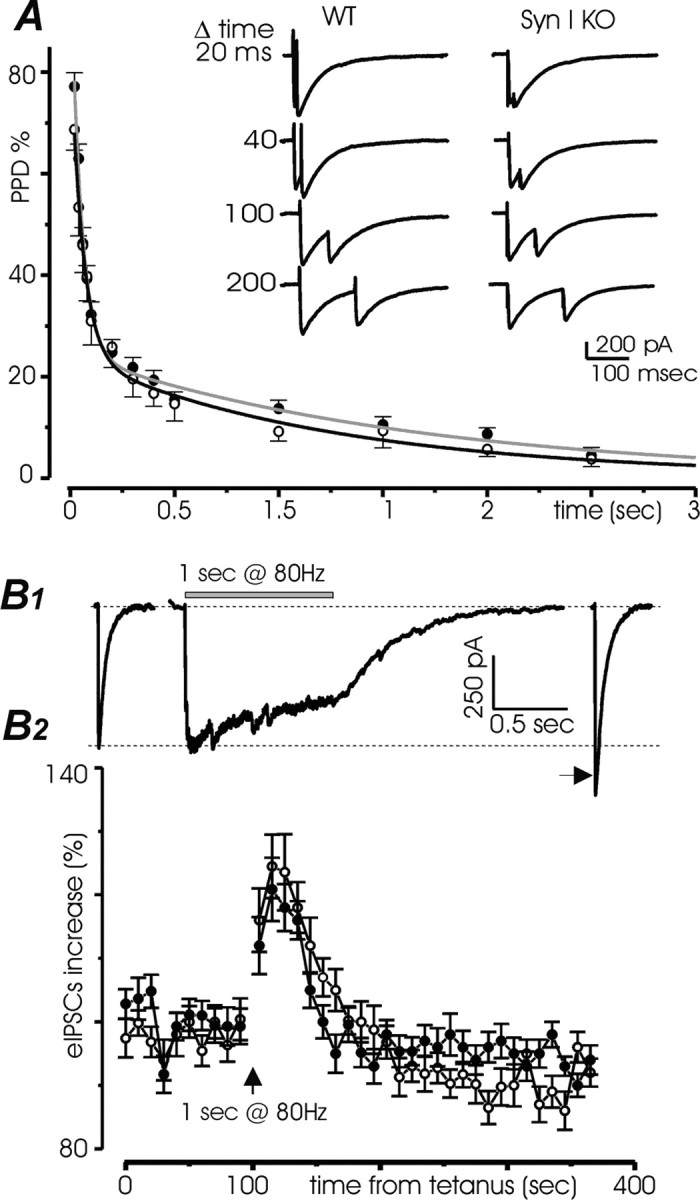
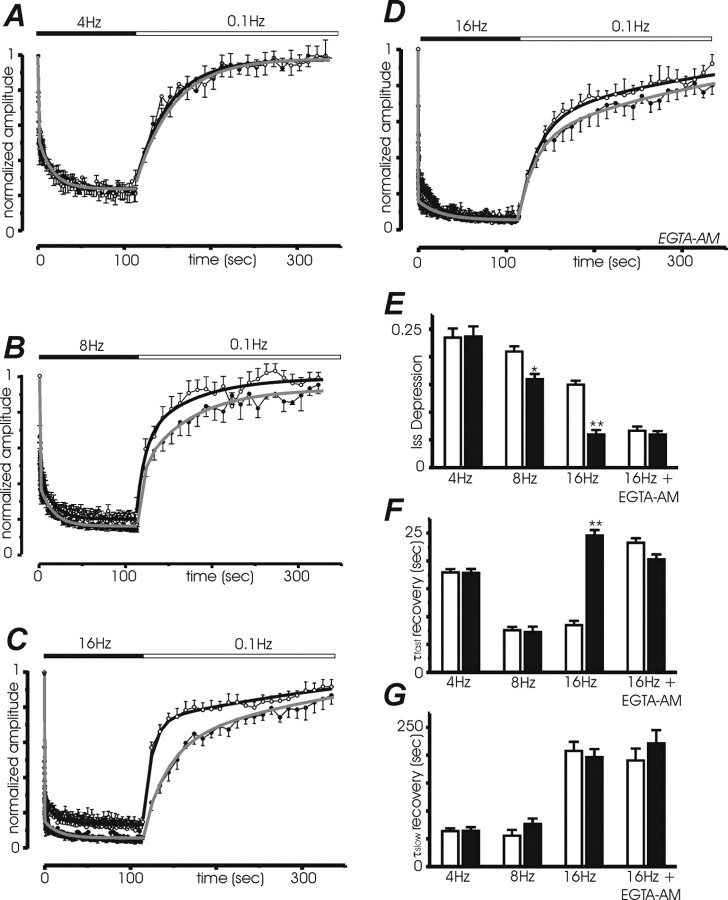
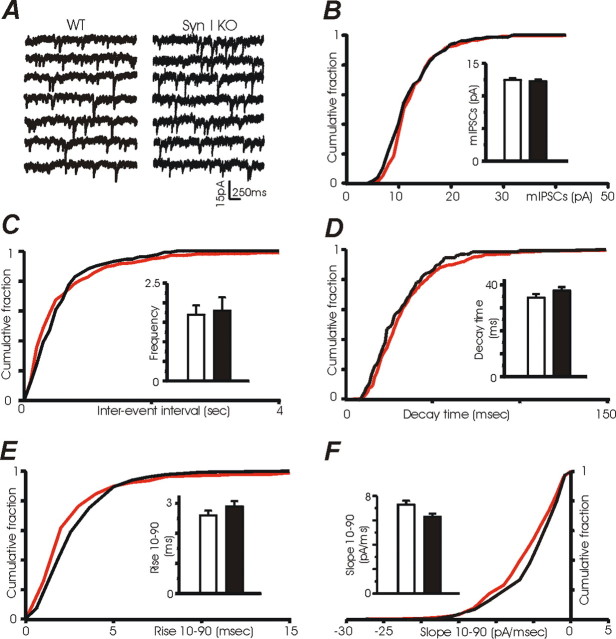
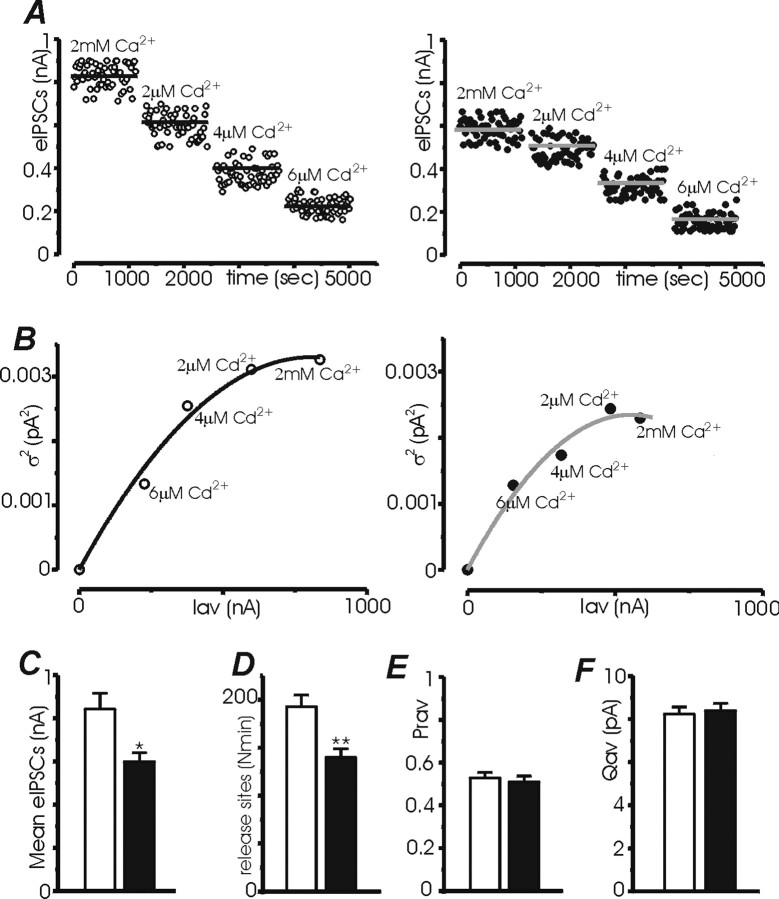
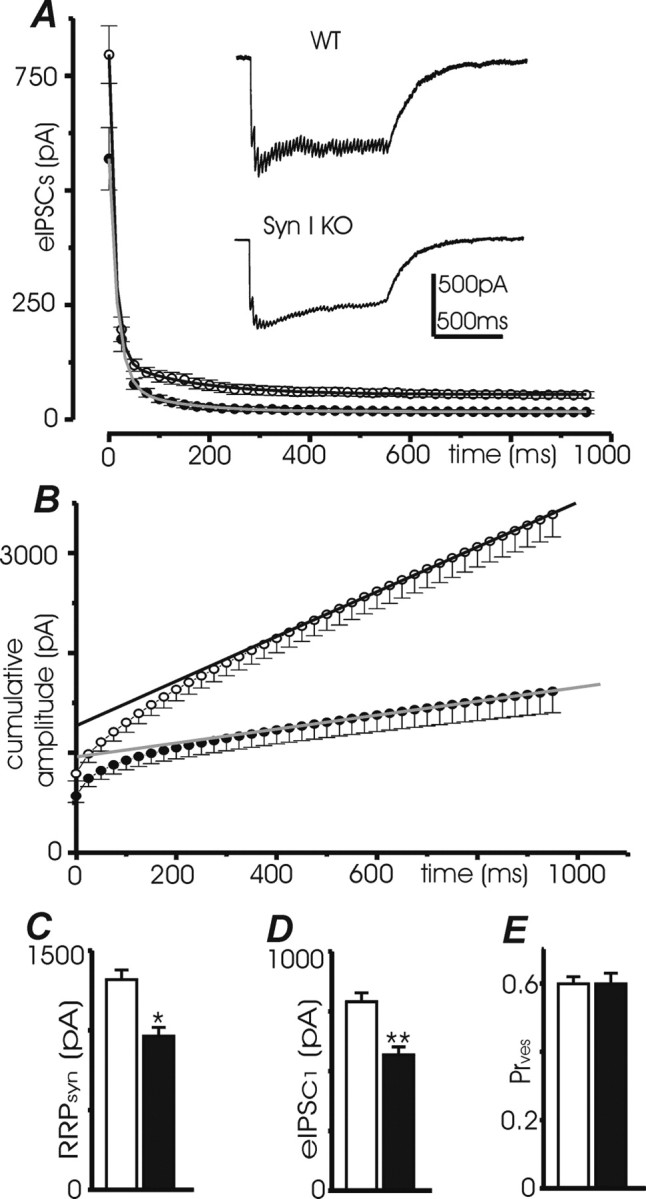
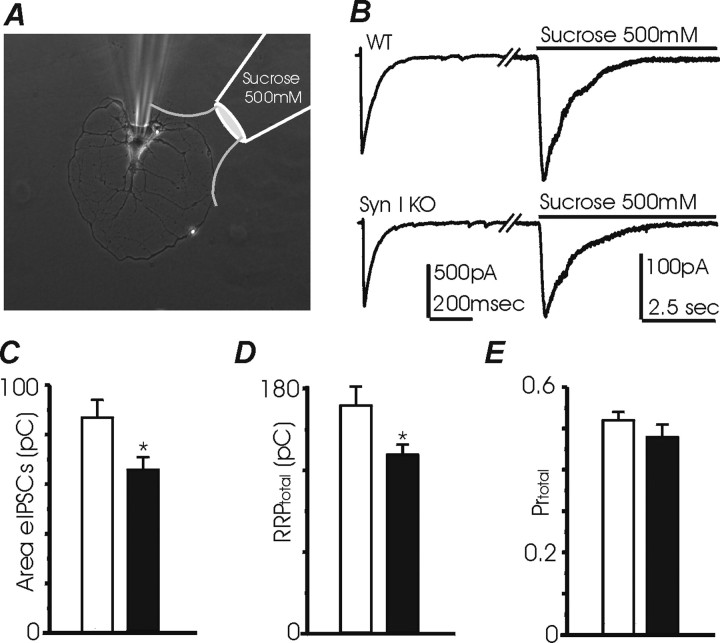
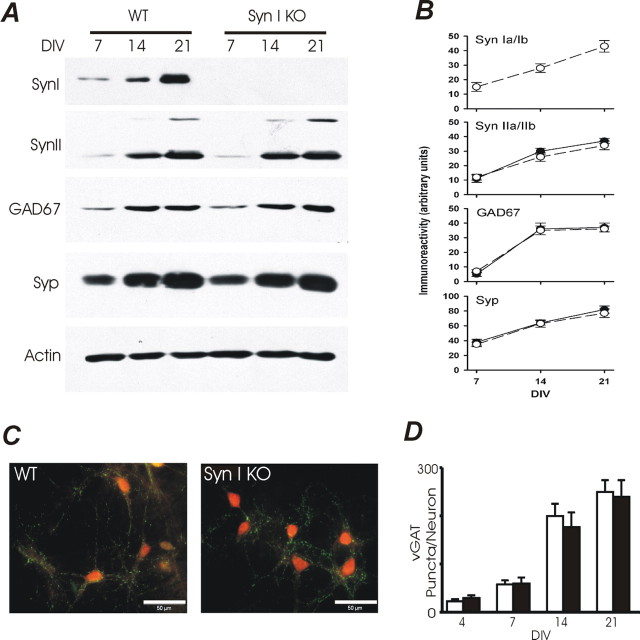
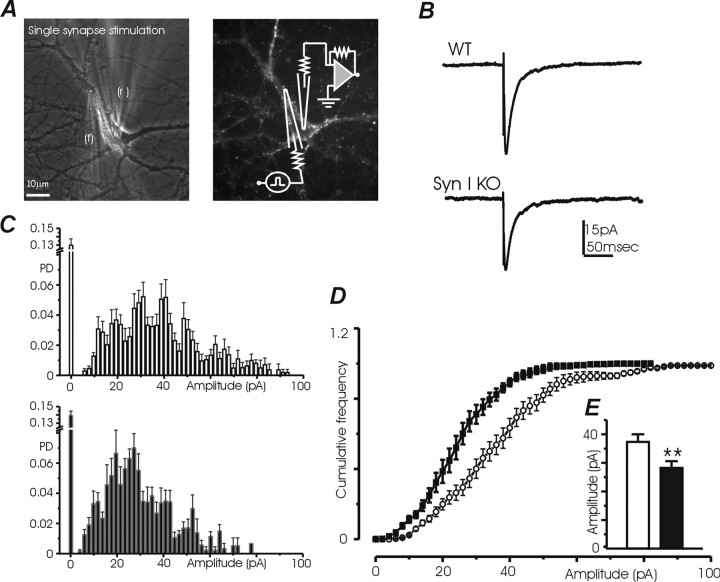
Synapsins (Syns) are synaptic vesicle (SV) phosphoproteins that play a role in neurotransmitter release and synaptic plasticity by acting at multiple steps of exocytosis. Mutation of SYN genes results in an epileptic phenotype in mouse and man suggesting a role of Syns in the control of network excitability. We have studied the effects of the genetic ablation of the SYN1 gene on inhibitory synaptic transmission in primary hippocampal neurons. Inhibitory neurons lacking SynI showed reduced amplitude of IPSCs evoked by isolated action potentials. The impairment in inhibitory transmission was caused by a decrease in the size of the SV readily releasable pool, rather than by changes in release probability or quantal size. The reduction of the readily releasable pool was caused by a decrease in the number of SVs released by single synaptic boutons in response to the action potential, in the absence of variations in the number of synaptic contacts between couples of monosynaptically connected neurons. The deletion of SYN1 did not affect paired-pulse depression or post-tetanic potentiation, but was associated with a moderate increase of synaptic depression evoked by trains of action potentials, which became apparent at high stimulation frequencies and was accompanied by a slow down of recovery from depression. The decreased size of the SV readily releasable pool, coupled with a decreased SV recycling rate and refilling by the SV reserve pool, may contribute to the epileptic phenotype of SynI knock-out mice.


Figures

Figure 1.
Figure 1.
SynI deletion reduces the amplitude but not the kinetics of eIPSCs recorded at the soma of whole cell-clamped hippocampal neurons. A, Paired whole-cell recordings were used to record monosynaptic GABAergic eIPSCs from primary hippocampal neurons in the presence of CNQX (10 μm), CGP58845 (5 μm), and d-AP5 (50 μm). The presynaptic GABAergic neuron and a postsynaptic neuron were both clamped at −70 mV. eIPSCs were evoked by stimulating the GABAergic neuron with a step to + 50/+70 mV for 1 ms. Scale bar: 100 μm. B, Representative electrically evoked eIPSCs recorded after 21 DIV from WT and SynI KO neurons. C, Mean eIPSC amplitude (±SE) as a function of days in vitro in WT (white bars) and SynI KO (black bars) neurons. The effect of the lack of SynI becomes apparent only in functionally differentiated neurons (8 < n < 44 for each bar; *p < 0.05 vs WT, Tukey's multiple comparison test). D, Kinetic analysis of eIPSCs. Step depolarization (+50 mV; 1 ms) applied to a WT neuron (N1) evoked an autaptic eIPSC in N1 and a monosynaptic eIPSC in a synaptically connected neuron (N2) (top left). Rise and decay phases of eIPSC were fitted to single exponentials. The mean values (±SE) of activation (top right) and decay (bottom left) time constants (τ) and delay time (bottom right) revealed that the lack of SynI did not affect IPSC kinetics (n = 10 for both WT and SynI KO).
Figure 2.
Figure 2.
Lack of SynI does not affect paired-pulse depression (PPD) and PTP of eIPSCs. A, PPD of monosynaptic GABAergic transmission in cultured hippocampal neurons (14–24 DIV) from WT and KO mice. Eight consecutive postsynaptic responses to dual presynaptic stimulation were averaged (stimulation frequency 0.1 Hz). The amplitude of the second eIPSC was depressed with respect to the first one and showed greater variability. The percentage of PPD (PPD %) was calculated as 100 × [(I 1I 2)/I 1)], where I 1 and I 2 represent the mean amplitude of the first and second eIPSC averaged over eight consecutive responses, respectively. The mean PPD (±SE) observed in WT (white symbols; n = 20) and SynI KO (black symbols; n = 30) neurons is plotted as a function of the interpulse interval and fitted by a biexponential function (WT, black trace; KO, gray trace). The inset shows dual eIPSCs recorded from whole-cell clamped hippocampal neurons in response to paired stimuli separated by the indicated interpulse intervals (Δ time). B1, Left, Representative eIPSC elicited by single stimuli at 0.1 Hz. Middle, Postsynaptic current during a brief tetanization of the presynaptic neuron (1 s at 80 Hz). Right, Second eIPSC after the train (27% potentiation). B2, Mean PTP observed in pairs of neurons (21–28 DIV) from WT (white circles; n = 12) and SynI KO (black circles; n = 12) mice subjected to the train stimulation (arrowhead) as in B1. Post-tetanic single eIPSCs elicited at 0.1 Hz were normalized to the pretetanic eIPSC level. Peak PTP (24.4 ± 0.16 and 21.08 ± 0.17% for WT and KO neurons, respectively) was reached within 20 s and decayed to baseline after ∼60 s in both genotypes.
Figure 3.
Figure 3.
Depression and recovery from depression are altered in SynI KO neurons under high-frequency of stimulation. Synaptic depression and recovery from depression at hippocampal inhibitory synapses activated by trains lasting 110 s applied at 4, 8 or 16 Hz. The recovery from depression was obtained, in all cases, by lowering the stimulation frequency to 0.1 Hz. A–C, The data were normalized relative to the amplitude of the first eIPSC in the train. The plots of normalized eIPSC versus time during repetitive stimulation for 110 s at 4 Hz (A; n = 14 and 8 for WT and KO neurons, respectively), 8 Hz (B; n = 13 and 17 for WT and KO neurons, respectively), or 16 Hz (C; n = 20 for both WT and KO neurons) and during the following recovery period are shown (WT, white symbols; KO, black symbols). Only at higher stimulation frequencies, SynI mutant neurons show a stronger synaptic depression and a slowdown of the recovery from depression. D, The latter stimulation protocol (110 s at 16 Hz) was repeated after treatment with the cell-permeable Ca2+ chelator EGTA-AM (50 μm, 45 min) which lowers Ca2+ far away from the membrane (n = 13 for both WT and KO neurons). Only one experimental point every 10 is plotted in the plateau phase of depression for clarity. Depression and recovery curves were fitted using a biexponential model (WT, black trace; KO, red trace). E–G, Mean values (±SE) of the resulting normalized steady-state current during depression (Iss; E), as well as the fast (τ fast; F) and slow (τ slow; G) time constants of recovery under the various experimental conditions and for WT (white bars) and KO (black bars) neurons, respectively. *p < 0.05; **p < 0.01 vs WT neurons; Tukey's multiple comparison test.
Figure 4.
Figure 4.
Analysis of mIPSCs. A, Consecutive recordings of mIPSCs in WT and SynI KO neurons at 22 DIV. B, Cumulative amplitude distribution curves calculated for WT (black trace) and SynI KO (red trace) neurons. The inset shows the mean amplitude (±SE) of mIPSCs for WT (white bar; n = 6) and SynI KO (black bar; n = 6). All cumulative curves and mean values were obtained from 200 to 800 events recorded from each cell. C, Cumulative interevent interval distribution (inset, mean frequency value). D, Cumulative distribution and mean value (inset) of the 50% decay time. E, Cumulative distribution and mean value (inset) of the rise (10–90%) time. F, Cumulative distribution and mean value (inset) of the slope (10–90%) of the rising phase.
Figure 5.
Figure 5.
Estimation of the quantal parameters of synaptic transmission by multiprobability fluctuation analysis. A, Plots of eIPSCs amplitude versus time analyzed at various levels of release probability obtained by varying the external Cd2+ concentration (0, 2, 4, 6 μm) in representative WT (left) and SynI KO (right) neurons (21–28 DIV). The horizontal lines show the mean amplitude during each epoch. B, The variance in eIPSC amplitude is plotted against the mean amplitude for each epoch and fitted with a parabola to estimate the release probability (Pr av), the average quantal size (Q av), and the mean number of release sites (N min) (left, WT; right, KO). C–F, Mean (±SE) values of average eIPSC amplitude (C), number of release sites (D), probability of release (E), and quantal size (F). **p < 0.01; *p < 0.05 versus WT, two-tailed Student's t test. n = 9 and n = 8 for WT and SynI KO neurons, respectively.
Figure 6.
Figure 6.
Estimate of RRP and Pr by using the cumulative amplitude profile analysis. A, Plot of mean eIPSCs amplitude (±SE) versus time during repetitive stimulations at 40 Hz of WT and SynI KO neurons (21–28 DIV; n = 25 for both genotypes) fitted with the biexponential function: I(t) = yo + Af e (−tf) + As e (−ts) (WT, black trace; KO, gray trace). Representative recordings during a train of 40 stimuli at 40 Hz in single WT and SynI KO neurons are shown in the inset. Extracellular stimulation artifacts were removed. B, Cumulative eIPSC amplitude profile. To estimate the RRP, data points in the range of 0.4–0.9 s were fitted by linear regression and back-extrapolated to time 0 (WT, black trace; KO, gray trace) to estimate the cumulative eIPSC amplitude before steady-state depression (RRPsyn). C–E, The size of RRPsyn (C), the amplitude of the first eIPSC in the train (D), and the calculated Pr ves (E) are shown as means ± SE (WT, white bars; KO, black bars). **p < 0.01 versus WT, two-tailed Student's t test. n = 25 for both WT and SynI KO.
Figure 7.
Figure 7.
Estimation of RRPtotal and Pr total by hypertonic stimulation of autaptic GABAergic neurons. A, Phase-contrast micrograph of an inhibitory autaptic neuron electrically stimulated by a patch pipette and perfused 60 s later with a hypertonic solution (extracellular medium containing 500 mm sucrose) applied for 10 s. B, Autaptic eIPSCs and responses to hypertonic solution for representative WT and SynI KO neurons are shown. C, Mean charge transfer (±SE) associated with an autaptic IPSC evoked by an isolated action potential (stimulation frequency, 0.05 Hz). D, Estimated mean RRPtotal (±SE) obtained by stimulation with a hypertonic solution. E, Mean Pr total (±SE) of the eIPSC obtained by dividing the charge transfer of the eIPSC by the charge transfer of the response induced by the hypertonic solution. (WT, white bars; KO, black bars) *p < 0.05, two-tailed Student's t test. n = 8 for both genotypes.
Figure 8.
Figure 8.
Expression of presynaptic proteins and number of GABAergic synaptic contacts are not affected by SynI deletion in hippocampal neurons during in vitro differentiation. A, Protein extracts (10 μg/lane) from WT and SynI KO hippocampal neurons were prepared at the indicated DIV and analyzed for the expression levels of synapsin Ia/Ib (SynI), synapsin IIa/IIb (SynII), GAD67, and synaptophysin (Syp). A representative immunoblot is shown. Equal loading was confirmed by the constant actin levels. B, Immunoblots from three independent replications of the experiment shown in A were quantitatively analyzed by densitometric scanning of the fluorograms. The developmental patterns of expression of SynI, SynII, GAD67 and Syp in WT (open symbols) and KO (closed symbols) neurons as a function of the days in vitro (DIV) are plotted as means ± SE in arbitrary units. C, Hippocampal neurons from WT (left panel) or Syn I KO (right panel) mice were fixed at 21 DIV and immunostained for V-GAT (green) and NeuN (red). V-GAT-positive puncta were counted and normalized by the cell number. Scale bar: 50 μm. D, The total number of inhibitory terminals in WT (white bars) and SynI KO (black bars) cultures was obtained by automatic counting and divided by the number of neurons in the field (10–15 images for each age in culture and from at least 3 preparations conducted in parallel). No significant differences in the density of GABAergic terminals were observed between WT and KO neurons at the various DIV analyzed.
Figure 9.
Figure 9.
Analysis of GABAergic transmission at single synaptic boutons. A, Left, Phase-contrast micrograph of a glass pipette for focal stimulation (f) and a recording patch pipette (r) on a hippocampal neuron. Right, Fluorescence image showing presynaptic FM1–43-stained boutons on the neuronal soma. TTX was included in the bath solution to block action potentials. Scale bar: 10 μm. B, Representative eIPSCs recorded from WT and SynI KO neurons in response to stable single-bouton activation (100–200 brief focal stimulations of 5 μA for 1 ms applied at 0.1 Hz in the presence of TTX) are shown. C, Mean density probability histogram of single bouton eIPCSs for WT (white bars; n = 9) and SynI KO (black bars; n = 11) neurons. Data were analyzed with a bin size of 2 pA. The mean failure rate is shown on the left (centered at 0 pA). D, Mean cumulative frequency versus amplitude plot (bin size, 2 pA). E, In the inset, the mean amplitude (±SE) of eIPSCs is reported for WT (white bar) and SynI KO (black bar) neurons. **p < 0.01 versus WT, two-tailed Student's t test.

References

    1. Atwood HL, Karunanithi S. Diversification of synaptic strength: presynaptic elements. Nat Rev Neurosci. 2002;3:497–516. - PubMed
    1. Baldelli P, Forni PE, Carbone E. BDNF, NT-3 and NGF induce distinct new Ca2+ channel synthesis in developing hippocampal neurons. Eur J Neurosci. 2000;12:4017–4032. - PubMed
    1. Baldelli P, Novara M, Carabelli V, Hernández-Guijo JM, Carbone E. BDNF up-regulates evoked GABAergic transmission in developing hippocampal neurons by potentiating presynaptic N- and P/Q-type Ca2+ channels signaling. Eur J Neurosci. 2002;16:2297–2310. - PubMed
    1. Baldelli P, Hernandez-Guijo JM, Carabelli V, Carbone E. Brain-derived neurotrophic factor enhances GABA release probability and nonuniform distribution of N- and P/Q-type channels on release sites of hippocampal inhibitory synapses. J Neurosci. 2005;25:3358–3368. - PMC - PubMed
    1. Baldelli P, Fassio A, Corradi A, Valtorta F, Benfenati F. The synapsins and the control of neuroexocytosis. In: Regazzi R, editor. Molecular mechanisms of exocytosis. Georgetown, TX: Landes Bioscence; 2006. pp. 62–74.

Publication types

LinkOut - more resources