

Hippocampal poly(ADP-Ribose) polymerase 1 and caspase 3 activation in neonatal bornavirus infection
- PMID: 18057239
- PMCID: PMC2258717
- DOI: 10.1128/JVI.02014-07
Hippocampal poly(ADP-Ribose) polymerase 1 and caspase 3 activation in neonatal bornavirus infection
Abstract
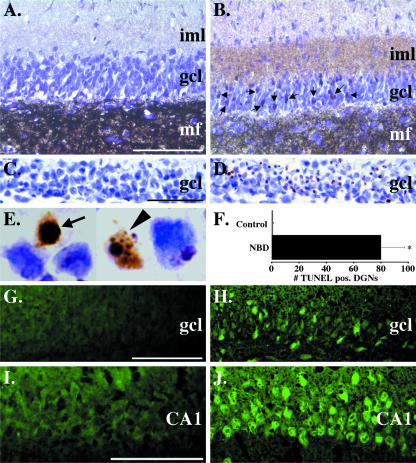
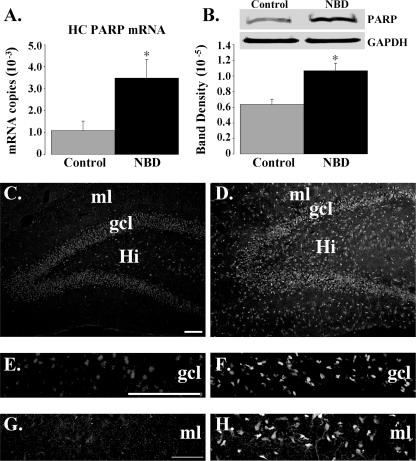
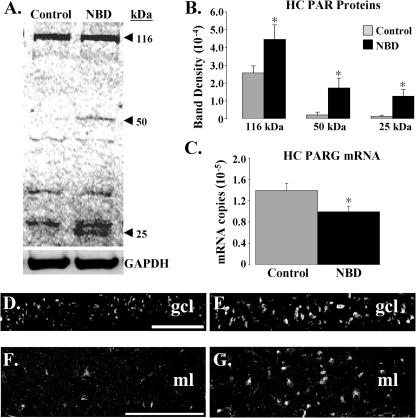
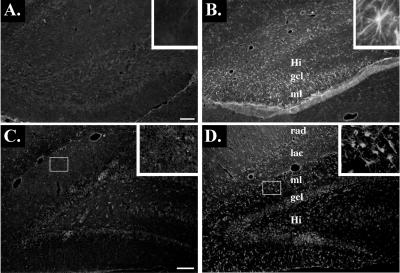
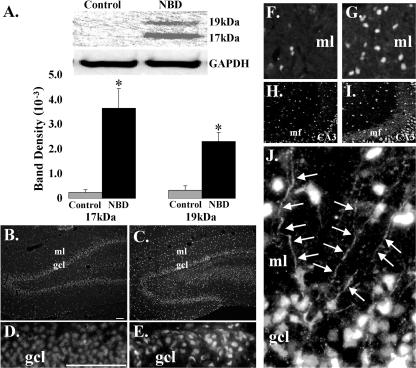
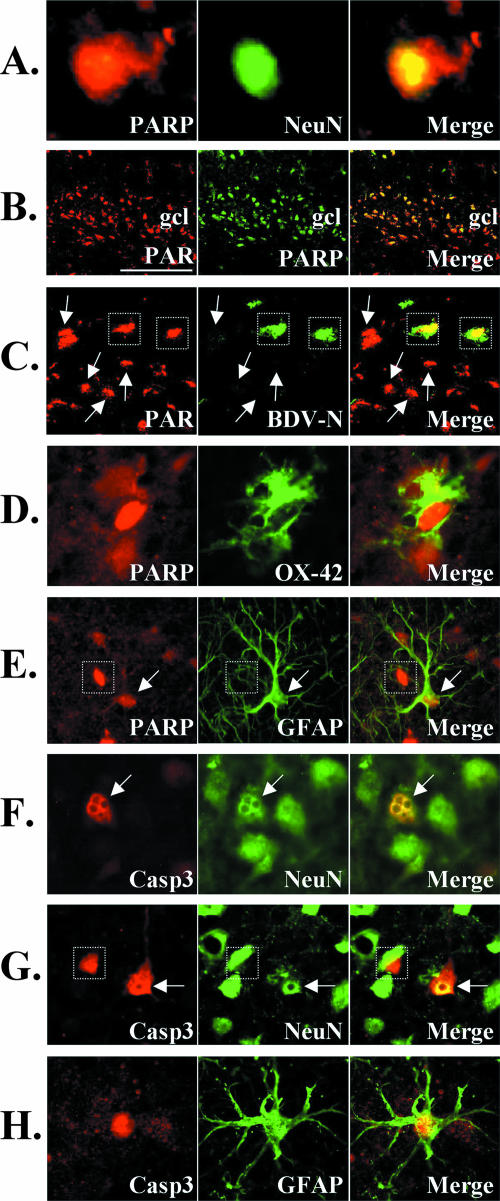
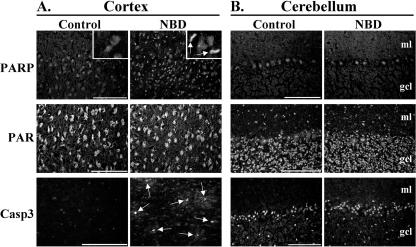
Infection of neonatal rats with Borna disease virus results in a characteristic behavioral syndrome and apoptosis of subsets of neurons in the hippocampus, cerebellum, and cortex (neonatal Borna disease [NBD]). In the NBD rat hippocampus, dentate gyrus granule cells progressively degenerate. Apoptotic loss of granule cells in NBD is associated with accumulation of zinc in degenerating neurons and reduced zinc in granule cell mossy fibers. Excess zinc can trigger poly(ADP-ribose) polymerase 1 (PARP-1) activation, and PARP-1 activation can mediate neuronal death. Here, we evaluate hippocampal PARP-1 mRNA and protein expression levels, activation, and cleavage, as well as apoptosis-inducing factor (AIF) nuclear translocation and executioner caspase 3 activation, in NBD rats. PARP-1 mRNA and protein levels were increased in NBD hippocampi. PARP-1 expression and activity were increased in granule cell neurons and glia with enhanced ribosylation of proteins, including PARP-1 itself. In contrast, levels of poly(ADP-ribose) glycohydrolase mRNA were decreased in NBD hippocampi. PARP-1 cleavage and AIF expression were also increased in astrocytes in NBD hippocampi. Levels of activated caspase 3 protein were increased in NBD hippocampi and localized to nuclei, mossy fibers, and dendrites of granule cell neurons. These results implicate aberrant zinc homeostasis, PARP-1, and caspase 3 activation as contributing factors in hippocampal neurodegeneration in NBD.
Figures
Similar articles
-
Metallothioneins and zinc dysregulation contribute to neurodevelopmental damage in a model of perinatal viral infection.Brain Pathol. 2006 Jan;16(1):1-14. doi: 10.1111/j.1750-3639.2006.tb00556.x. Brain Pathol. 2006. PMID: 16612977 Free PMC article.
-
Simultaneous cell death and upregulation of poly(ADP-ribose) polymerase-1 expression in early postnatal mouse retina.Invest Ophthalmol Vis Sci. 2011 Sep 27;52(10):7445-54. doi: 10.1167/iovs.11-7222. Invest Ophthalmol Vis Sci. 2011. PMID: 21705688
-
Poly(ADP-ribose) polymerase (PARP)-1-independent apoptosis-inducing factor (AIF) release and cell death are induced by eleostearic acid and blocked by alpha-tocopherol and MEK inhibition.J Biol Chem. 2010 Apr 23;285(17):13079-91. doi: 10.1074/jbc.M109.044206. Epub 2010 Feb 22. J Biol Chem. 2010. PMID: 20177052 Free PMC article.
-
Structure and function of poly(ADP-ribose) polymerase-1: role in oxidative stress-related pathologies.Curr Vasc Pharmacol. 2005 Jul;3(3):209-14. doi: 10.2174/1570161054368625. Curr Vasc Pharmacol. 2005. PMID: 16026317 Review.
-
Poly(ADP-ribose) signals to mitochondrial AIF: a key event in parthanatos.Exp Neurol. 2009 Aug;218(2):193-202. doi: 10.1016/j.expneurol.2009.03.020. Epub 2009 Mar 28. Exp Neurol. 2009. PMID: 19332058 Free PMC article. Review.
Cited by
-
Animal models of CNS viral disease: examples from borna disease virus models.Interdiscip Perspect Infect Dis. 2010;2010:709791. doi: 10.1155/2010/709791. Epub 2010 Feb 24. Interdiscip Perspect Infect Dis. 2010. PMID: 20204069 Free PMC article.
-
Notch/HES1-mediated PARP1 activation: a cell type-specific mechanism for tumor suppression.Blood. 2011 Mar 10;117(10):2891-900. doi: 10.1182/blood-2009-12-253419. Epub 2011 Jan 11. Blood. 2011. PMID: 21224467 Free PMC article.
-
Central Nervous System Infection with Borna Disease Virus Causes Kynurenine Pathway Dysregulation and Neurotoxic Quinolinic Acid Production.J Virol. 2017 Jun 26;91(14):e00673-17. doi: 10.1128/JVI.00673-17. Print 2017 Jul 15. J Virol. 2017. PMID: 28446679 Free PMC article.
-
Chinese herb related molecules of cancer-cell-apoptosis: a minireview of progress between Kanglaite injection and related genes.J Exp Clin Cancer Res. 2008 Aug 21;27(1):31. doi: 10.1186/1756-9966-27-31. J Exp Clin Cancer Res. 2008. PMID: 18718024 Free PMC article. Review.
-
Proteomics reveal energy metabolism and mitogen-activated protein kinase signal transduction perturbation in human Borna disease virus Hu-H1-infected oligodendroglial cells.Neuroscience. 2014 May 30;268:284-96. doi: 10.1016/j.neuroscience.2014.03.009. Epub 2014 Mar 15. Neuroscience. 2014. PMID: 24637096 Free PMC article.
References
-
- Allan, S. M., and N. J. Rothwell. 2001. Cytokines and acute neurodegeneration. Nat. Rev. Neurosci. 2734-744. - PubMed
-
- Armstrong, R. C., T. J. Aja, K. D. Hoang, S. Gaur, X. Bai, E. S. Alnemri, G. Litwack, D. S. Karanewsky, L. C. Fritz, and K. J. Tomaselli. 1997. Activation of the CED3/ICE-related protease CPP32 in cerebellar granule neurons undergoing apoptosis but not necrosis. J. Neurosci. 17553-562. - PMC - PubMed
-
- Baksi, K., H. Alkhatib, and M. E. Smulson. 1987. In vivo characterization of the poly(ADP-ribosylation) of SV40 chromatin and large T antigen by immunofractionation. Exp. Cell Res. 172110-123. - PubMed
-
- Bezzi, P., M. Domercq, L. Brambilla, R. Galli, D. Schols, E. De Clercq, A. Vescovi, G. Bagetta, G. Kollias, J. Meldolesi, and A. Volterra. 2001. CXCR4-activated astrocyte glutamate release via TNFα: amplification by microglia triggers neurotoxicity. Nat. Neurosci. 4702-710. - PubMed
Publication types
MeSH terms
Substances
Grants and funding
LinkOut - more resources
Full Text Sources
Medical
Research Materials
Miscellaneous
