. 2008 Jul 20;27(16):2999-3016.
doi: 10.1002/sim.3136.

A likelihood-based method for real-time estimation of the serial interval and reproductive number of an epidemic

Affiliations

A likelihood-based method for real-time estimation of the serial interval and reproductive number of an epidemic

L Forsberg White et al. Stat Med. .

Abstract

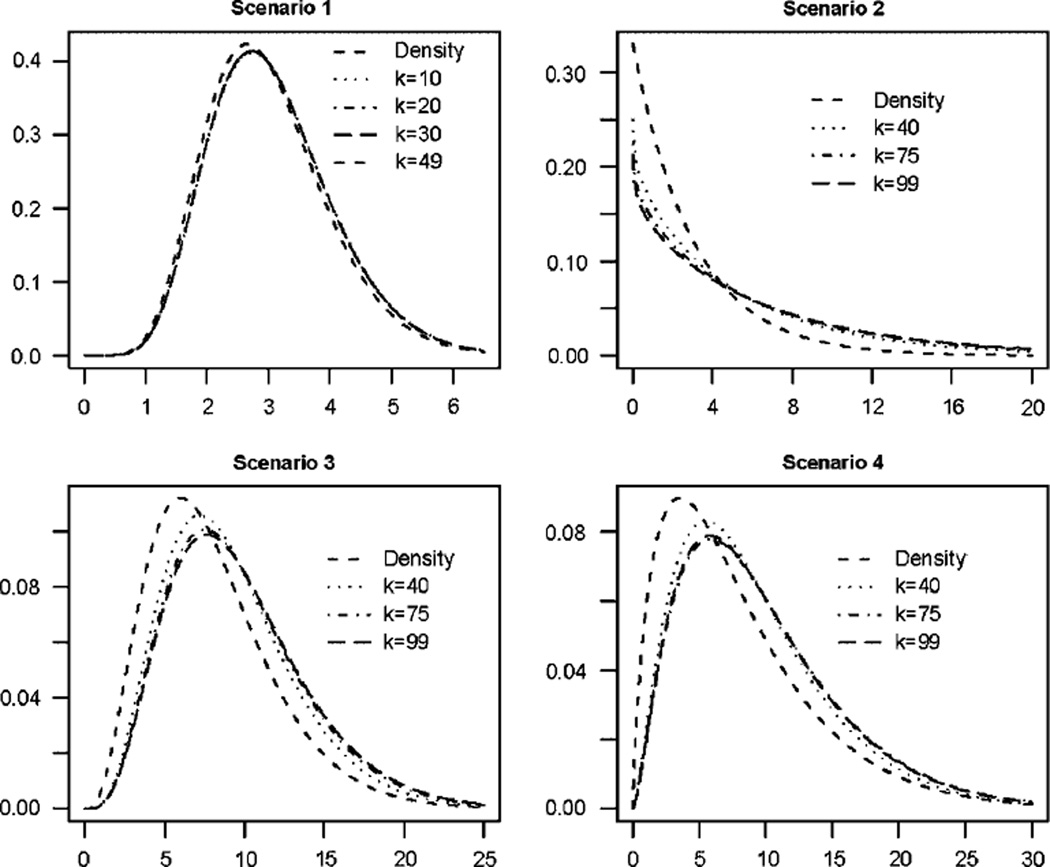
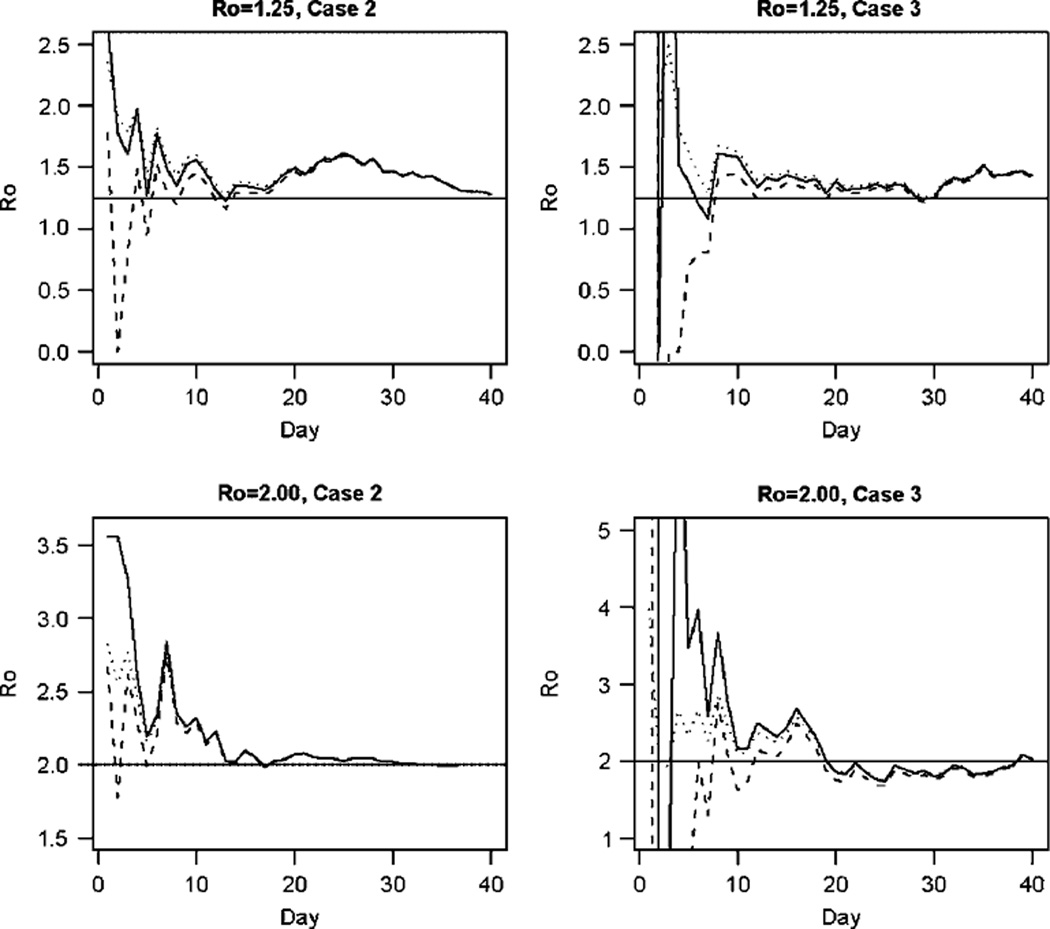
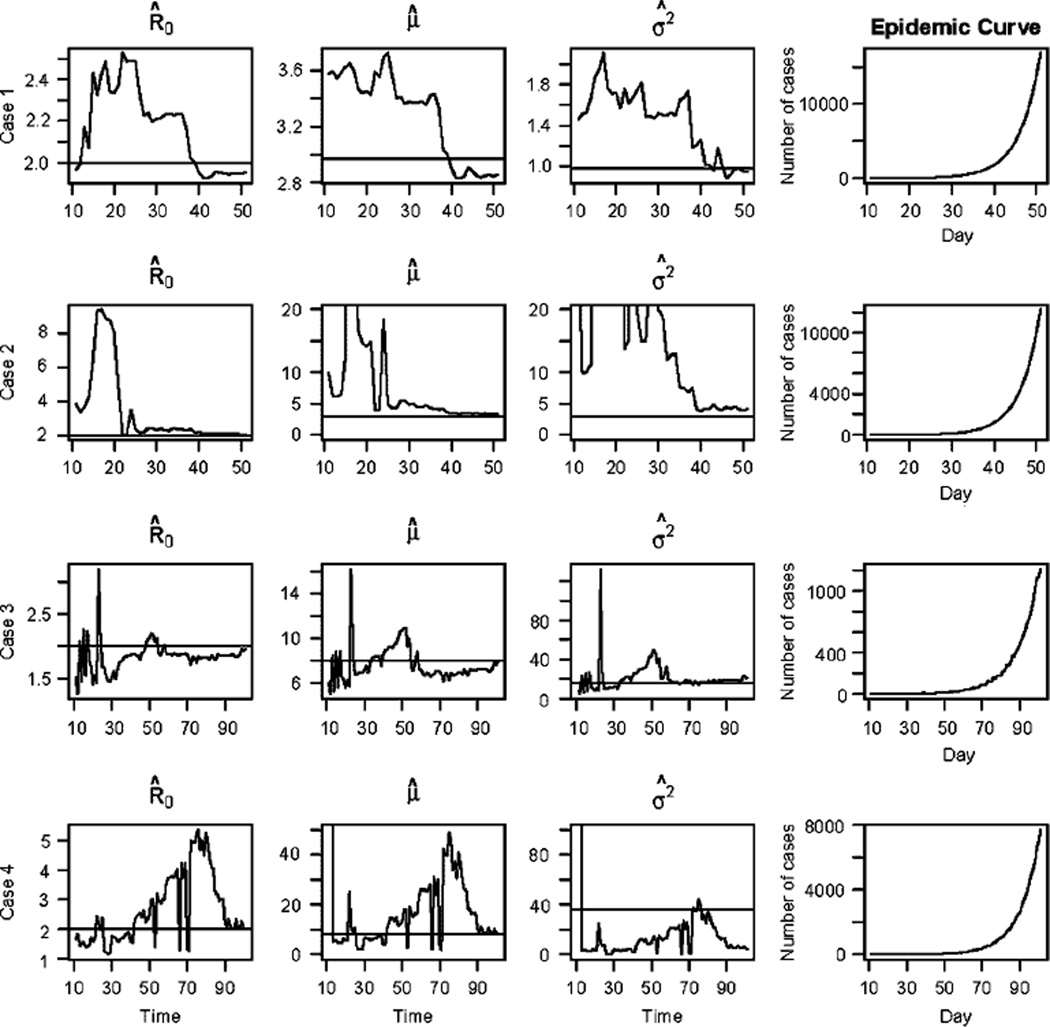
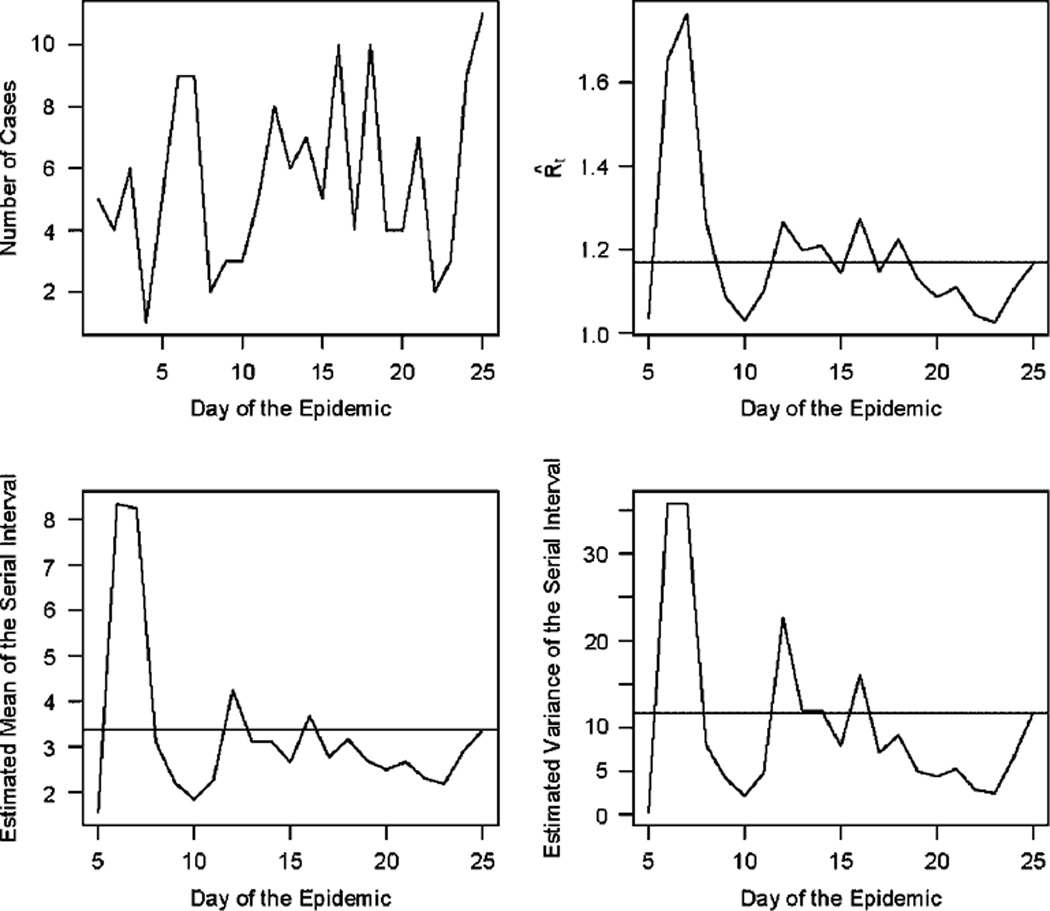
We present a method for the simultaneous estimation of the basic reproductive number, R(0), and the serial interval for infectious disease epidemics, using readily available surveillance data. These estimates can be obtained in real time to inform an appropriate public health response to the outbreak. We show how this methodology, in its most simple case, is related to a branching process and describe similarities between the two that allow us to draw parallels which enable us to understand some of the theoretical properties of our estimators. We provide simulation results that illustrate the efficacy of the method for estimating R(0) and the serial interval in real time. Finally, we implement our proposed method with data from three infectious disease outbreaks.


Figures

Figure 1
Figure 1
Estimated gamma densities when R0=2.0 and with varying k. The cases are the different serial interval gamma densities described in the text. Case 1 has a mean of 2.97 and variance of 0.98. Case 2 has mean and variance 3.00 and 9.18, respectively. The mean and variance of case 3 are 8.00 and 16.00, while the mean and variance of case 4 are 8.00 and 36.00.
Figure 2
Figure 2
Real-time estimates of R0. The solid line traces the MLE estimate through time. The Bayesian posterior mode is shown. The finer dashed line represents estimating with an informative prior while the longer dashed line represents estimates with an uninformative prior. Cases 2 and 3 are described in the text.
Figure 3
Figure 3
Real-time estimates for the parameters when R0=2. Analysis began 10 days after the start of the epidemic. Each row in the figure presents the estimates obtained for a single simulation from the corresponding serial interval case (1–4), as described in the text, the final column shows the epidemic curve for the simulation used in that row.
Figure 4
Figure 4
Real-time estimates for the Avian Influenza epidemic. The first plot shows the epidemic curve of the data. The remaining three plots show the estimates of the parameters at each day of the epidemic during the growth phase.

References

    1. Fraser C, Riley S, Anderson R, Ferguson N. Factors that make an infectious disease outbreak controllable. Proceedings of the National Academy of Sciences. 2004;101:6146–6151. - PMC - PubMed
    1. Bauch C, Lloyd-Smith J, Coffee M, Galvani A. Dynamically modeling SARS and other newly emerging respiratory illnesses. Epidemiology. 2005;16:791–801. - PubMed
    1. Svensson A. A note on generation times in epidemic models. Mathematical Biosciences. 2007;208:300–311. - PubMed
    1. Lipsitch M, Cohen T, Cooper B, Robins J, Ma S, James L, Gopalakrishna G, Chew SK, Tan CC, Samore M, et al. Transmission dynamics and control of Severe Acute Respiratory Syndrome. Science. 2003;300:1966–1970. - PMC - PubMed
    1. Wallinga J, Teunis P. Different epidemic curves for Severe Acute Respiratory Syndrome reveal similar impacts of control measures. American Journal of Epidemiology. 2004;160:509–516. - PMC - PubMed

Publication types

LinkOut - more resources