

Glutathione content as a potential mediator of the vulnerability of cultured fetal cortical neurons to ethanol-induced apoptosis
- PMID: 18058941
- PMCID: PMC3727902
- DOI: 10.1002/jnr.21562
Glutathione content as a potential mediator of the vulnerability of cultured fetal cortical neurons to ethanol-induced apoptosis
Abstract
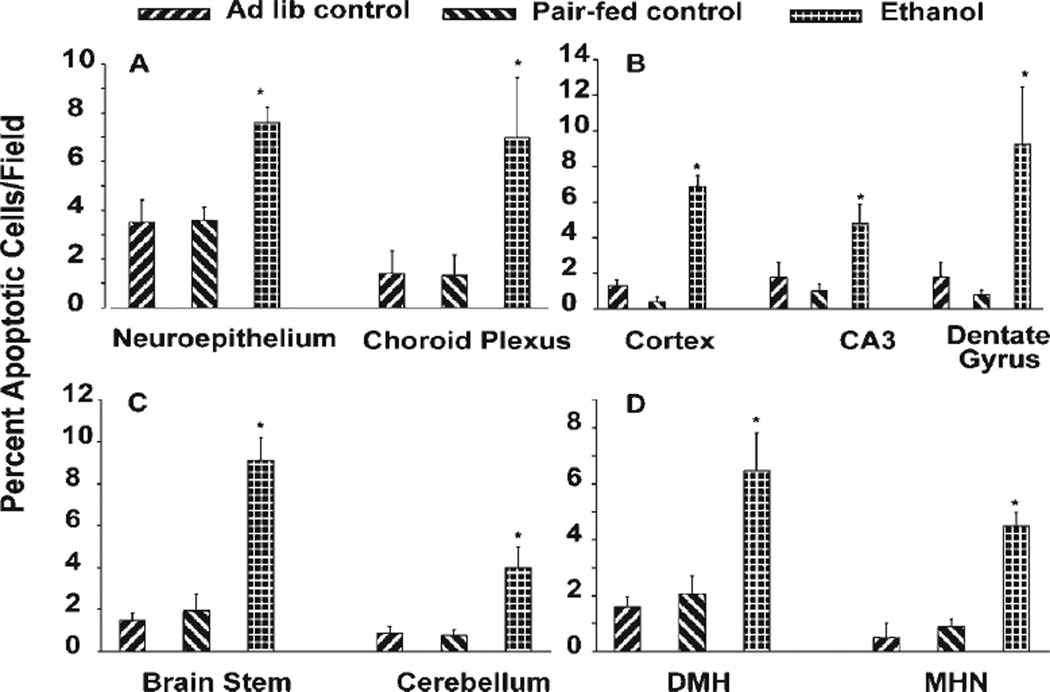
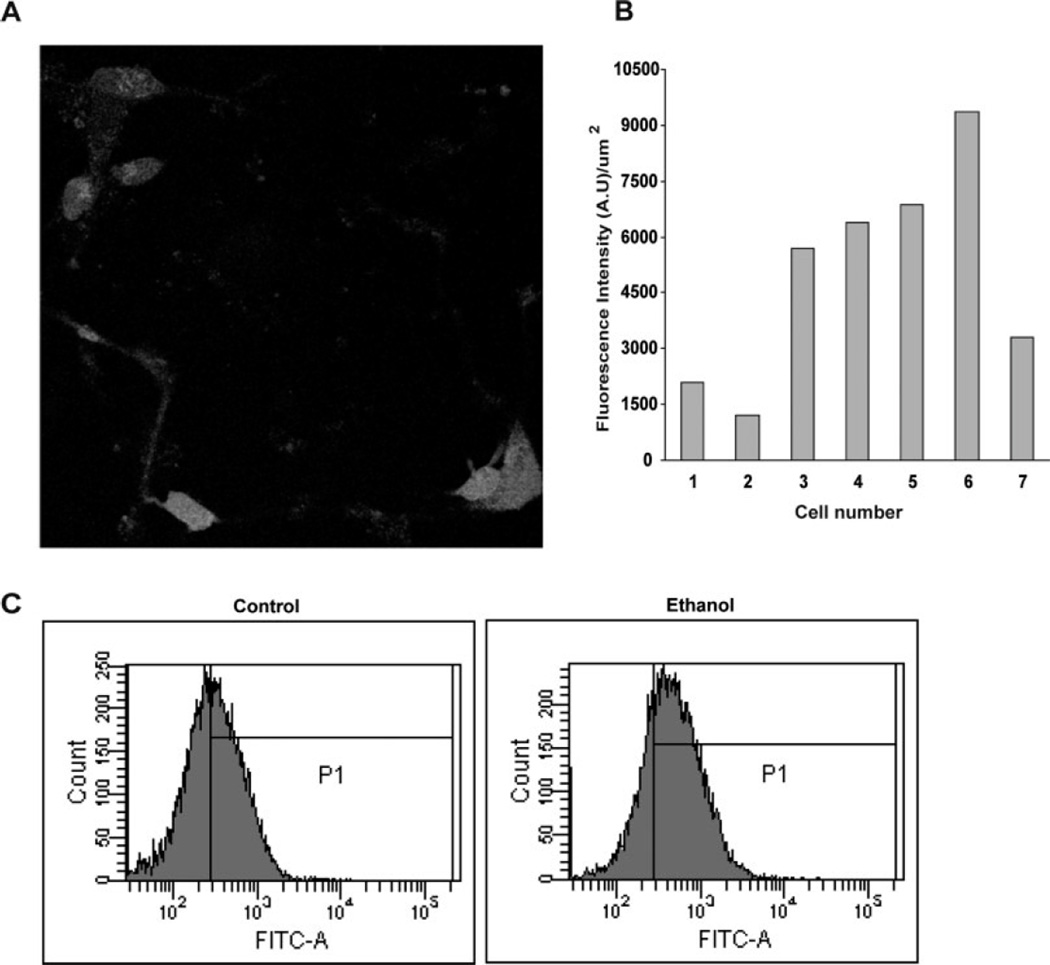
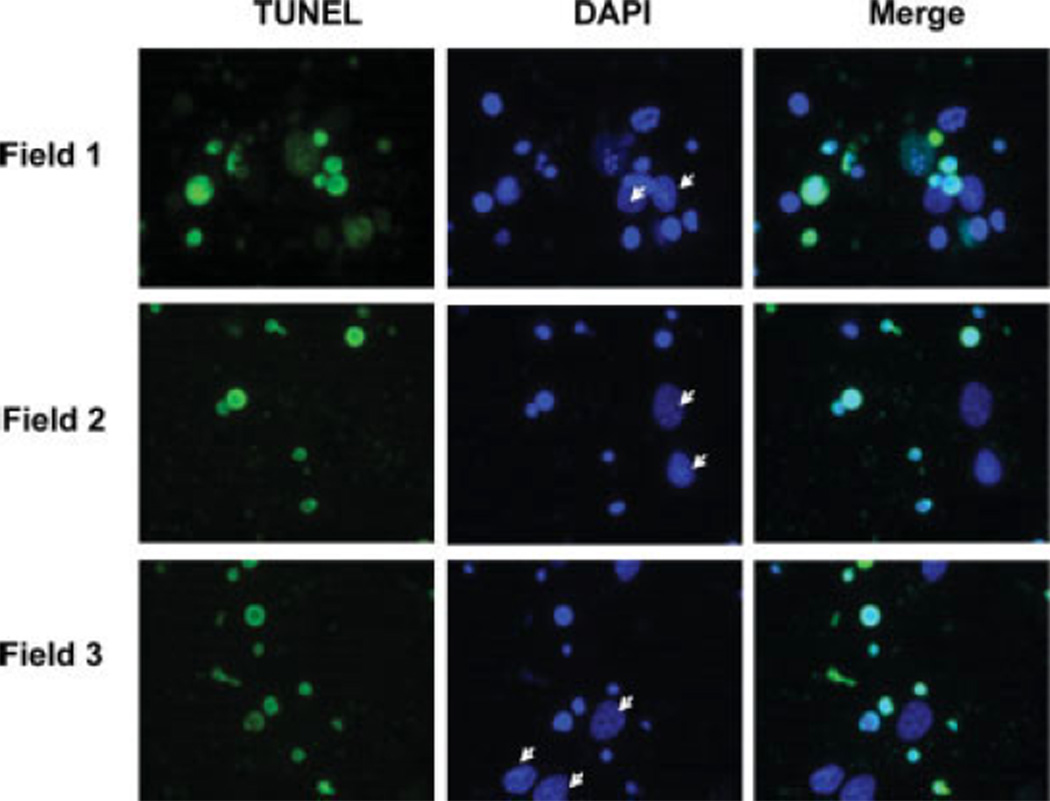
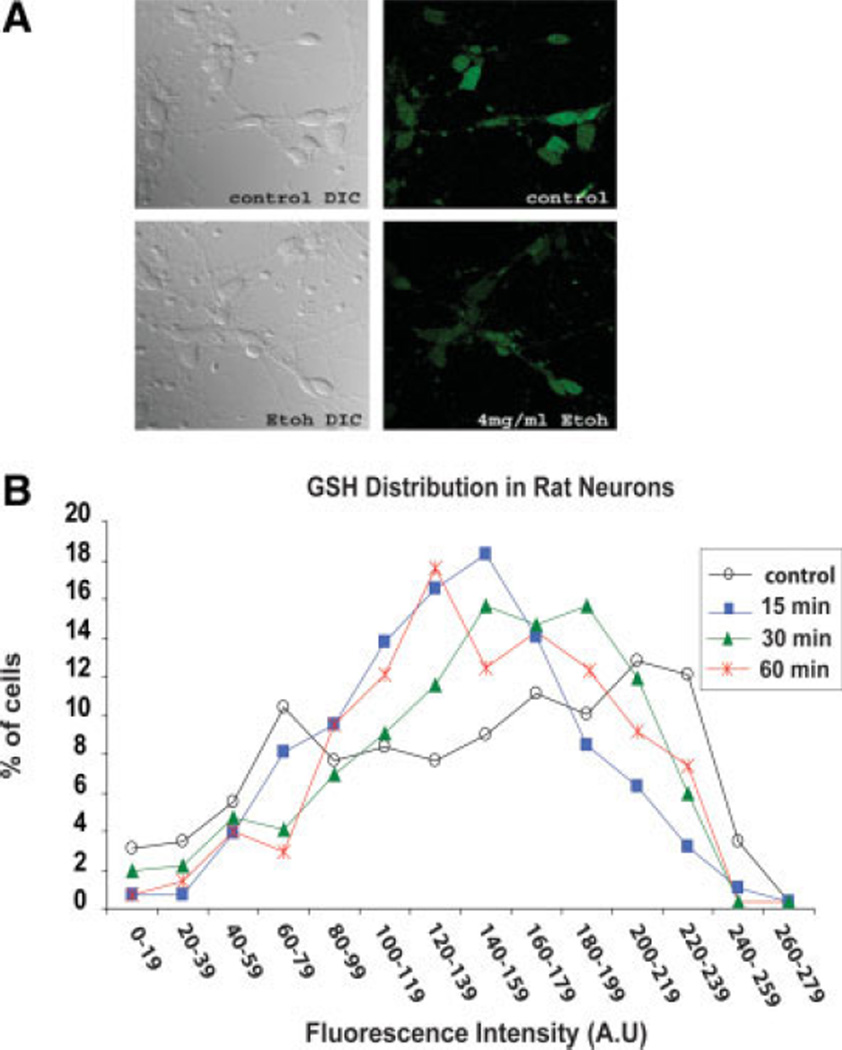
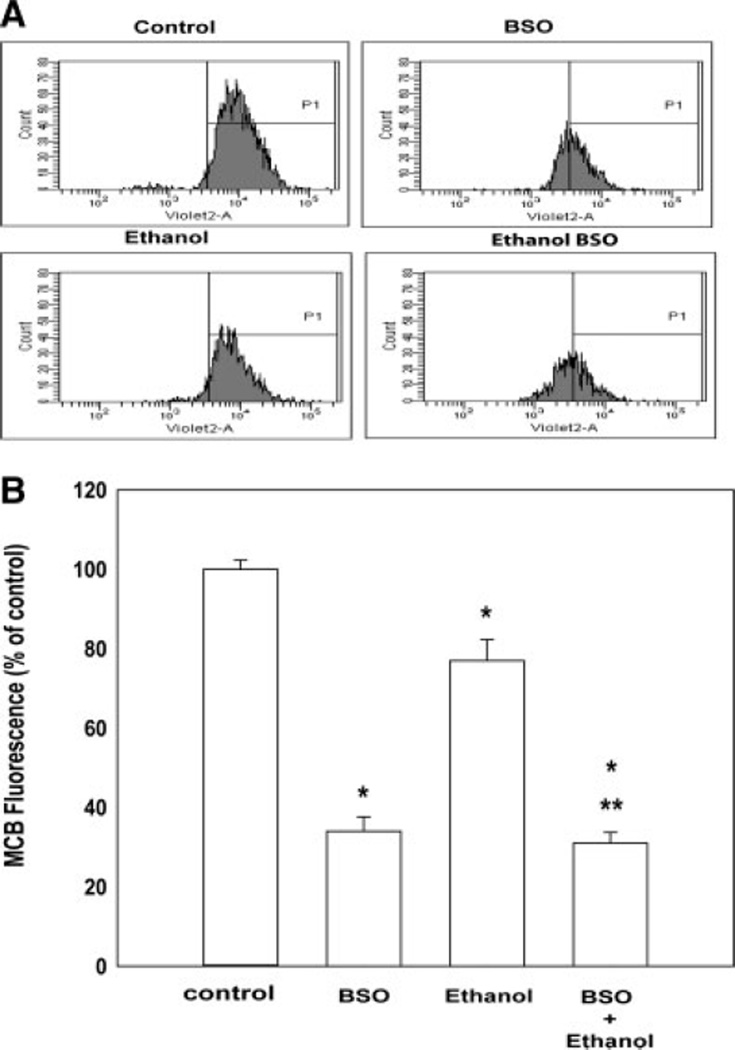
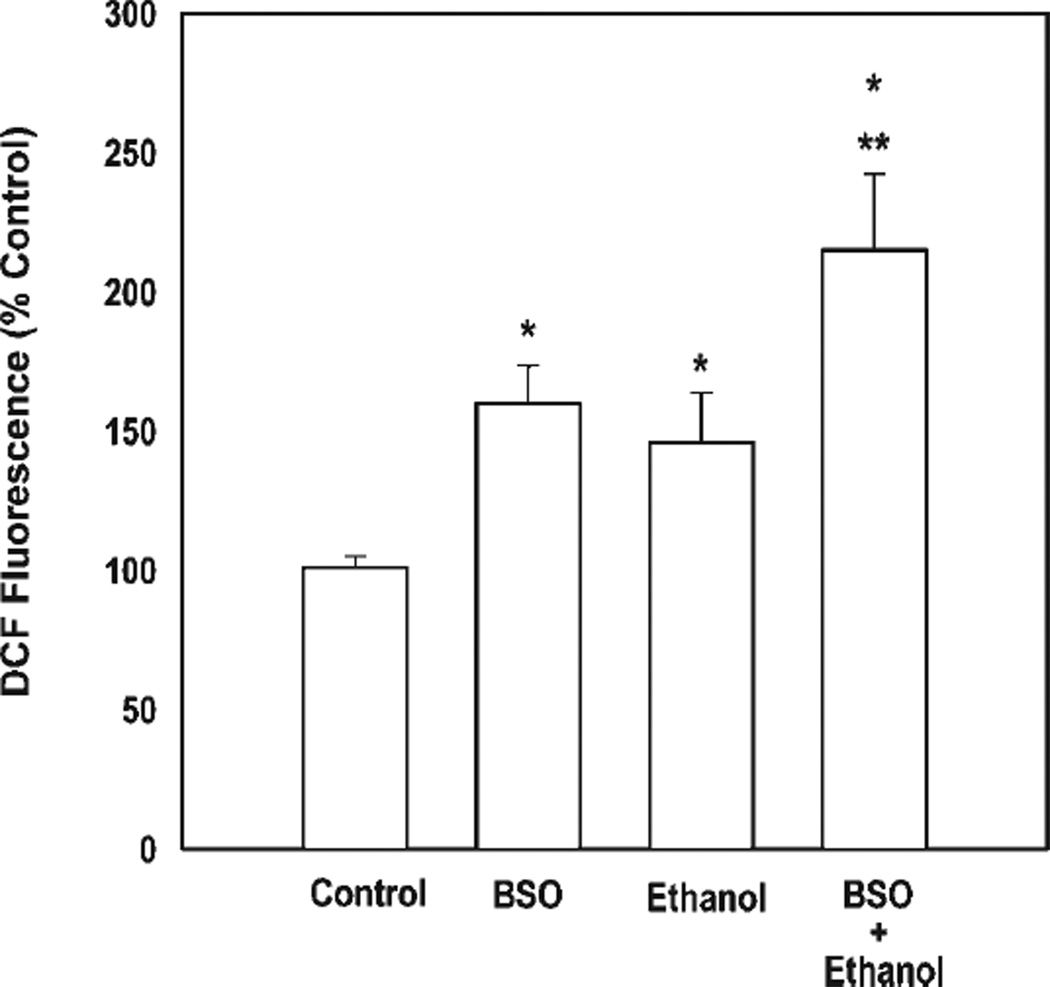
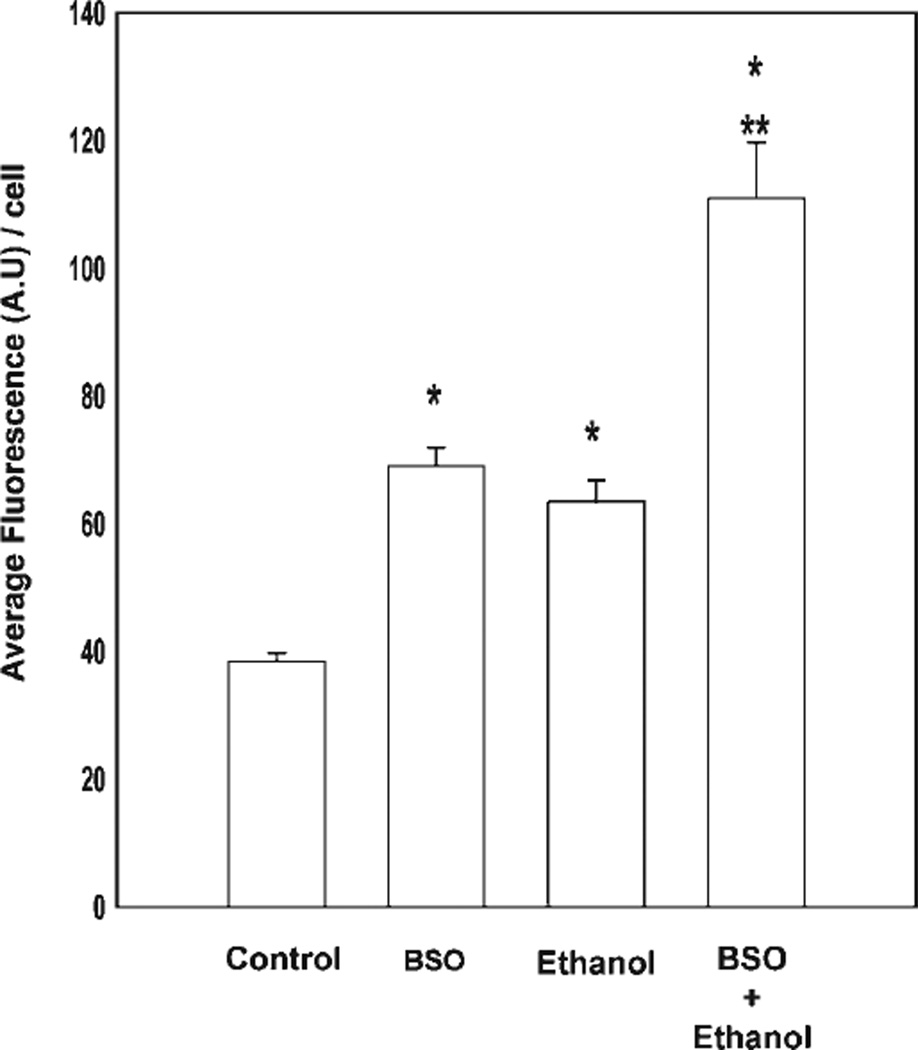
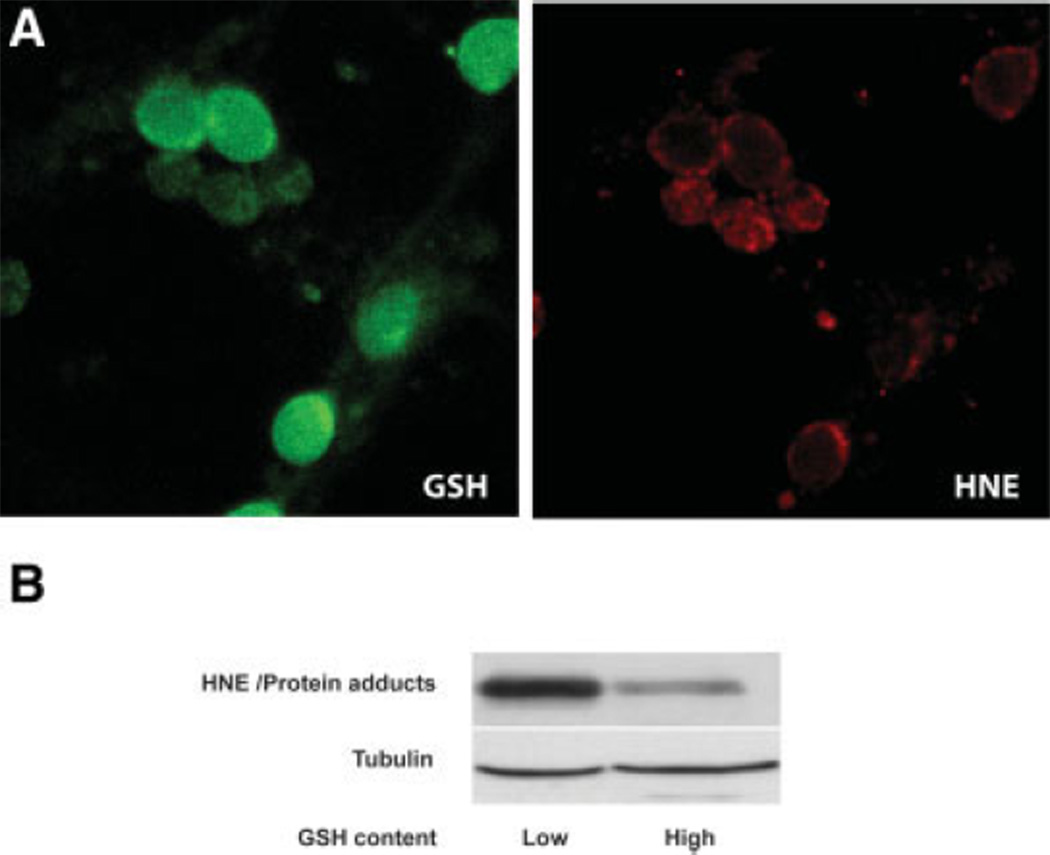
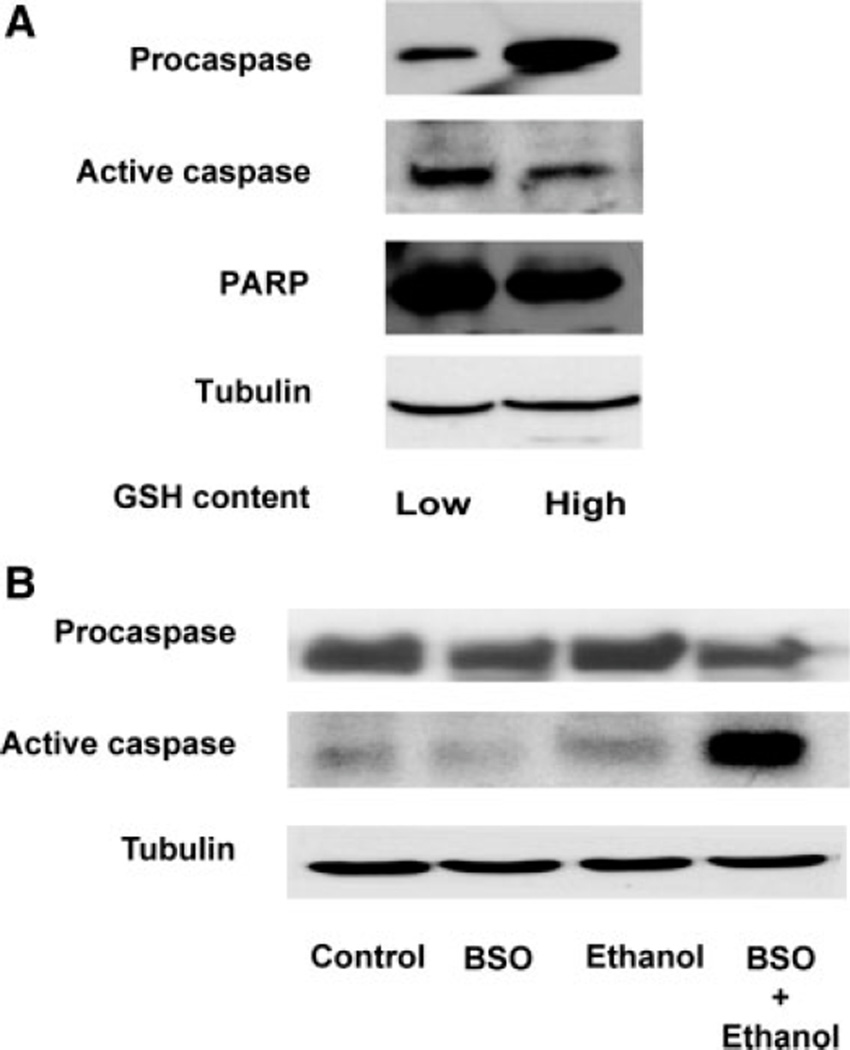
Ethanol ingestion during pregnancy elicits damage to the developing brain, some of which appears to result from enhanced apoptotic death of neurons. A consistent characteristic of this phenomenon is a highly differing sensitivity to ethanol within specific neuron populations. One possible explanation for this "selective vulnerability" could be cellular variations in glutathione (GSH) homeostasis. Prior studies have illustrated that ethanol elicits apoptotic death of neurons in the developing brain, that oxidative stress may be an underlying mechanism, and that GSH can be neuroprotective. In the present study, both multiphoton microscopy and flow cytometry demonstrate a striking heterogeneity in GSH content within cortical neuron populations. Ethanol differentially elicits apoptotic death and oxidative stress in these neurons. When neuron GSH content is reduced by treatment with butathione sulfoxamine, the ethanol-mediated enhancement of reactive oxygen species is exacerbated. Sorting of cells into high- and low-GSH populations further exemplifies ethanol-mediated oxidative stress whereby apoptotic indices are preferentially elevated in the low-GSH population. Western blot analysis of the low-GSH subpopulations shows higher ethanol-mediated expression of active caspase 3 and 24-kDa PARP-1 fragments compared with the high-GSH subpopulation. In addition, neuronal content of 4-hydroxynonenal adducts is higher in low-GSH neurons in response to ethanol. These studies suggest that GSH content is an important predictor of neuronal sensitivity to ethanol-mediated oxidative stress and subsequent cell death. The data support the proposition that the differences in proapoptotic responses to ethanol within specific neuron populations reflect a heterogeneity of neuron GSH content.
Figures
Similar articles
-
Ethanol-mediated DNA damage and PARP-1 apoptotic responses in cultured fetal cortical neurons.Alcohol Clin Exp Res. 2008 Nov;32(11):1884-92. doi: 10.1111/j.1530-0277.2008.00769.x. Epub 2008 Aug 20. Alcohol Clin Exp Res. 2008. PMID: 18717656 Free PMC article.
-
Ethanol-induced oxidative stress precedes mitochondrially mediated apoptotic death of cultured fetal cortical neurons.J Neurosci Res. 2003 Nov 15;74(4):577-88. doi: 10.1002/jnr.10767. J Neurosci Res. 2003. PMID: 14598302
-
Poly(ADP-ribose) polymerase-1 protects neurons against apoptosis induced by oxidative stress.Cell Death Differ. 2007 Jun;14(6):1211-21. doi: 10.1038/sj.cdd.4402117. Epub 2007 Mar 9. Cell Death Differ. 2007. PMID: 17347665
-
Neuronal trauma model: in search of Thanatos.Int J Dev Neurosci. 2004 Nov;22(7):485-96. doi: 10.1016/j.ijdevneu.2004.07.015. Int J Dev Neurosci. 2004. PMID: 15465278 Review.
-
Mechanisms of ethanol-induced death of cerebellar granule cells.Cerebellum. 2012 Mar;11(1):145-54. doi: 10.1007/s12311-010-0219-0. Cerebellum. 2012. PMID: 20927663 Free PMC article. Review.
Cited by
-
Role for Cystathionine γ Lyase (CSE) in an Ethanol (E)-Induced Lesion in Fetal Brain GSH Homeostasis.Int J Mol Sci. 2018 May 22;19(5):1537. doi: 10.3390/ijms19051537. Int J Mol Sci. 2018. PMID: 29786653 Free PMC article.
-
Metabolic changes and DNA hypomethylation in cerebellum are associated with behavioral alterations in mice exposed to trichloroethylene postnatally.Toxicol Appl Pharmacol. 2013 Jun 15;269(3):263-9. doi: 10.1016/j.taap.2013.03.025. Epub 2013 Apr 6. Toxicol Appl Pharmacol. 2013. PMID: 23566951 Free PMC article.
-
Microglia play a role in ethanol-induced oxidative stress and apoptosis in developing hypothalamic neurons.Alcohol Clin Exp Res. 2013 Feb;37(2):252-62. doi: 10.1111/j.1530-0277.2012.01889.x. Epub 2012 Jul 23. Alcohol Clin Exp Res. 2013. PMID: 22823548 Free PMC article.
-
Coenzyme Q10 reduces ethanol-induced apoptosis in corneal fibroblasts.PLoS One. 2011 Apr 27;6(4):e19111. doi: 10.1371/journal.pone.0019111. PLoS One. 2011. PMID: 21556371 Free PMC article.
-
Neurotoxicity of a polybrominated diphenyl ether mixture (DE-71) in mouse neurons and astrocytes is modulated by intracellular glutathione levels.Toxicol Appl Pharmacol. 2008 Oct 15;232(2):161-8. doi: 10.1016/j.taap.2008.06.018. Epub 2008 Jul 4. Toxicol Appl Pharmacol. 2008. PMID: 18656495 Free PMC article.
References
-
- Barnes DE, Walker DW. Prenatal ethanol exposure permanently reduces the number of pyramidal neurons in rat hippocampus. Brain Res. 1981;227:333–340. - PubMed
-
- Castoldi AF, Coccini T, Ceccatelli S, Manzo L. Neurotoxicity and molecular effects of methylmercury. Brain Res Bull. 2001;55:197–203. - PubMed
-
- Chandler LJ, Sutton G, Norwood D, Sumners C, Crews FT. Chronic ethanol increases N-methyl-D-aspartate-stimulated nitric oxide formation but not receptor density in cultured cortical neurons. Mol Pharmacol. 1997;51:733–740. - PubMed
Publication types
MeSH terms
Substances
Grants and funding
LinkOut - more resources
Full Text Sources
Research Materials
Miscellaneous
