. 2008 Feb;4(2):195-204.
doi: 10.4161/auto.5278. Epub 2007 Nov 8.

Hypoxia induces autophagic cell death in apoptosis-competent cells through a mechanism involving BNIP3

Affiliations

Hypoxia induces autophagic cell death in apoptosis-competent cells through a mechanism involving BNIP3

Meghan B Azad et al. Autophagy. 2008 Feb.

Abstract

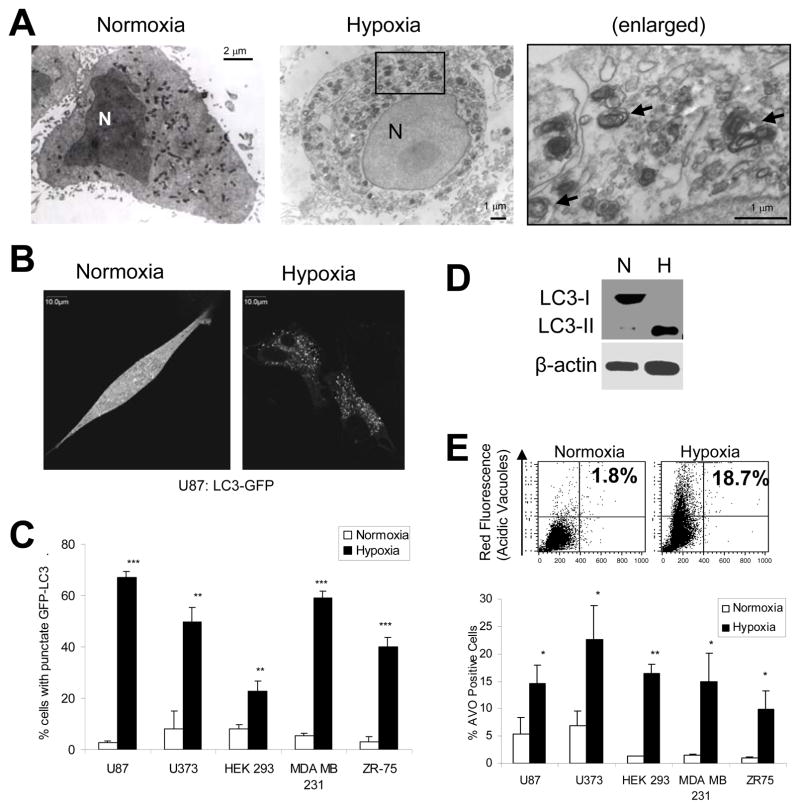
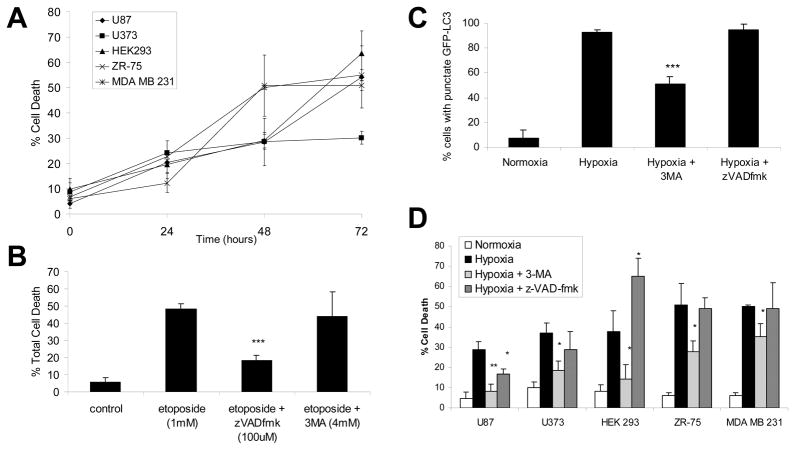
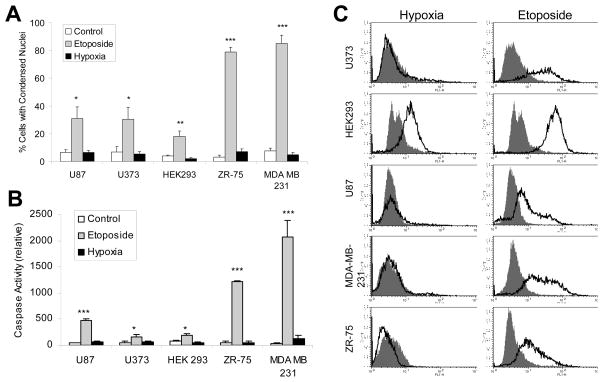
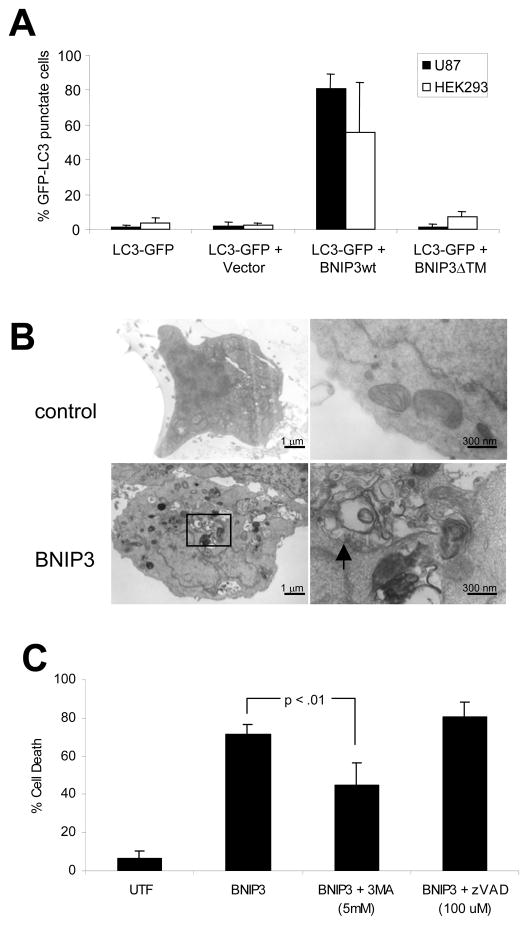
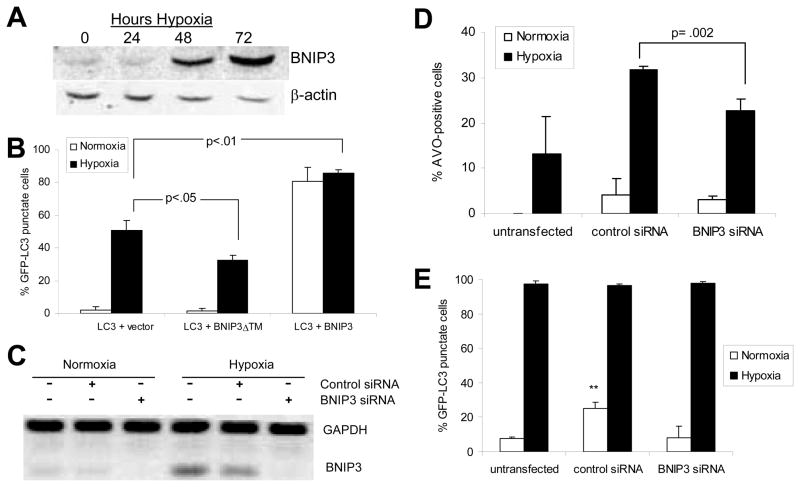
Hypoxia (lack of oxygen) is a physiological stress often associated with solid tumors. Hypoxia correlates with poor prognosis since hypoxic regions within tumors are considered apoptosisresistant. Autophagy (cellular "self digestion") has been associated with hypoxia during cardiac ischemia and metabolic stress as a survival mechanism. However, although autophagy is best characterized as a survival response, it can also function as a mechanism of programmed cell death. Our results show that autophagic cell death is induced by hypoxia in cancer cells with intact apoptotic machinery. We have analyzed two glioma cell lines (U87, U373), two breast cancer cell lines (MDA-MB-231, ZR75) and one embryonic cell line (HEK293) for cell death response in hypoxia (<1% O(2)). Under normoxic conditions, all five cell lines undergo etoposide-induced apoptosis whereas hypoxia fails to induce these apoptotic responses. All five cell lines induce an autophagic response and undergo cell death in hypoxia. Hypoxia-induced cell death was reduced upon treatment with the autophagy inhibitor 3-methyladenine, but not with the caspase inhibitor z-VAD-fmk. By knocking down the autophagy proteins Beclin-1 or ATG5, hypoxia-induced cell death was also reduced. The pro-cell death Bcl-2 family member BNIP3 (Bcl-2/adenovirus E1B 19kDainteracting protein 3) is upregulated during hypoxia and is known to induce autophagy and cell death. We found that BNIP3 overexpression induced autophagy, while expression of BNIP3 siRNA or a dominant-negative form of BNIP3 reduced hypoxia-induced autophagy. Taken together, these results suggest that prolonged hypoxia induces autophagic cell death in apoptosis-competent cells, through a mechanism involving BNIP3.


Conflict of interest statement

I have no conflict of interest or financial disclosure statements to declare.

Figures

Figure 1
Figure 1
Hypoxia induces autophagy in cancer cells. (A) Electron microscopy for detection of autophagosomes. U87 cells were incubated in normoxia or hypoxia for 24 hours followed by ultrastructural analysis by electron microscopy. Arrows indicate double-membraned autophagic vacuoles, in some cases containing mitochondria. (B) LC3-GFP distribution. U87-GFP-LC3 cells were incubated in normoxia or hypoxia for 24 hours. GFP-LC3 displayed diffuse intracellular localization under normoxic conditions, while membrane translocation (punctate localization) indicative of autophagy was observed in hypoxic cells. Images A and B were obtained using identical microscope settings, exposure times, and manipulations for brightness and contrast. (C) Quantification of GFP-LC3 translocation in transiently-transfected normoxic and hypoxic cells. 200 cells per sample were counted for punctate versus diffuse staining (representative of three independent experiments). (D) LC3 processing. U87 cells were incubated in normoxia (N) or 24 hours hypoxia (H). Total cell lysates were prepared and analyzed by Western Blot as described. LC3-II, which is produced during autophagy, migrates faster on SDS-PAGE. (E) Production of acidic vesicular organelles (AVOs). (Top) Cells incubated in normoxia or hypoxia for 48 hours were stained with acridine orange (1 μg/mL) and analyzed by flow cytometry to measure acid vacuole (AVO) production. Cytoplasm and nuclei fluoresce green while AVO/autophagosomes fluoresce red. (Bottom) Quantification of AVO production in normoxic and hypoxic cells (representative of three independent experiments). Error bars indicate standard deviation and statistical analysis was by unpaired student’s t-test: *p<.05, **p<.01, ***p<.001.
Figure 2
Figure 2
Hypoxia-induced cell death is blocked by the autophagic inhibitor 3-MA, but not by the caspase inhibitor z-VAD-fmk. (A) Total cell death in hypoxia. Cells were cultured in hypoxia over a 72-hour time course. Total cell death was determined by acridine orange membrane permeability assay as described in Materials and Methods. Compared to normoxic cells (time zero), cell death in hypoxic cells (48 and 72 hours) was significantly increased in all five cell types (p<.05, 1-tailed t-test). (B) Effect of autophagy and apoptosis inhibitors on etoposide-induced cell death. Cells were treated with 1mM etoposide for 48 hours in the presence or absence of specific inhibitors for autophagy (PI3-Kinase inhibitor 3-MA, 4 mM) or apoptosis (caspase inhibitor z-VAD-fmk, 100 μM). Total cell death was determined as in (A). (C) Effect of autophagy and apoptosis inhibitors on hypoxia-induced autophagy. U87-GFP-LC3 cells were incubated for 24 hours in normoxia or hypoxia, in the presence or absence if 3-MA or z-VAD-fmk. 200 cells per sample were counted for punctate versus diffuse staining. (D) Effect of autophagy and apoptosis inhibitors on hypoxia-induced cell death. Cells were incubated in hypoxia for 48 hours in the presence or absence of 3-MA or z-VAD-fmk. Total cell death was determined as in (B). All results represent three independent experiments and error bars indicate standard deviation. Statistical analysis was by unpaired t-test: *p<.05, **p<.01, ***p<.001.
Figure 3
Figure 3
Hypoxia-induced cell death is blocked by knock-down of Beclin-1 and ATG5. HEK293 cells were untransfected (control) or transiently transfected with siRNA against beclin-1 or Atg5, or a non-targetting control siRNA. (A) Western blot analysis with β-actin as a loading control at 72 hours post-transfection. Numerical values indicate protein quantification by densitometry, normalized to β-actin. (B) 72 hours post-transfection, cells were incubated in normoxia or hypoxia for a further 48 hours. Autophagy was assessed by detection of AVOs as described. (C) (Top) Total cell death was determined by trypan blue membrane permeability assay using flow cytometry as described in Materials and Methods. Red fluorescence yields two observable peaks, representing viable cells (first peak – weak fluorescence) and dead cells (second peak, unable to exclude the dye and therefore strongly fluorescent). (Bottom) Quantification of trypan blue assay using CellQuest software, representing four independent experiments. Error bars indicate standard deviation; statistical analysis was by unpaired student’s t-test: *p<.05, **p<.01, ***p<.001.
Figure 4
Figure 4
Hypoxia fails to induce apoptosis in apoptosis-competent cells. (A) Cells were untreated or treated with etoposide (100 μM) or incubated in hypoxia for 48 hours. Nuclear condensation was assessed by acridine orange and ethidium bromide staining as described in Materials and Methods. Results represent three independent experiments. (B) Cells treated as in (A) were assayed for caspase activity by a fluorometric caspase 3 substrate cleavage assay as described in Materials and Methods. Results represent three independent experiments. (C) Whole cell lysates from cells treated as in (A) were incubated with a FITC-tagged anti-phospho-H2A.X antibody, followed by flow cytometry. Solid curve represents untreated cells and line curve represents hypoxia or etoposide treated cells. The figure is representative of three independent experiments. Error bars indicate standard deviation; statistical significance was determined by unpaired t-test (*p<.05, **p<.01, ***p<.001).
Figure 5
Figure 5
BNIP3 induces autophagy and autophagic cell death. (A) HEK293 and U87 cells were transiently transfected with the autophagy marker GFP-LC3, alone or with PCDNA3 (empty vector) or PCDNA3-BNIP3 or PCDNA3-BNIP3ΔTM. Immunofluorescence for BNIP3 was performed as described in Materials and Methods. GFP-LC3 distribution (in co-transfected cells only) was assessed and quantified as in Fig. 1C. Error bars indicate standard deviation of three independent experiments. (B) HEK293 cells were untransfected (control) or transfected with BNIP3. Cells were analyzed by electron microscopy for detection of autophagosomes. (C) HEK293 cells were untransfected (control) or transfected with BNIP3. Cells were untreated or treated with 3-MA (5 mM) or z-VAD-fmk (100 μM) for 24 hours post-transfection. Immunofluorescence for BNIP3 was performed and cell death in BNIP3-positive cells was determined by assessing nuclear morphology as described. Error bars indicate standard deviation of three independent experiments. Statistical significance was determined by a two-tailed t-test.
Figure 6
Figure 6
BNIP3 plays a role in hypoxia-induced autophagic cell death. (A) Western blot showing upregulation of BNIP3 in hypoxia in HEK293 cells. (B) HEK293 cells transfected as in Fig. 6A were incubated in normoxia or hypoxia for 24-hours post-transfection. GFP-LC3 distribution (in co-transfected cells only) was assessed as in Fig. 1B. (C) U87 cells were untransfected, or transfected with control siRNA or BNIP3 siRNA and silencing of gene expression was verified by RT-PCR analysis as described in Materials and Methods. (D) Two days after siRNA silencing, U87 cells were retained in normoxia or exposed to 24 hours hypoxia, and AVO production was measured as in Fig. 1E. (E) Two days after siRNA silencing, U87-GFP-LC3 cells were retained in normoxia or exposed to 24 hours hypoxia, and GFP-LC3 distribution was assessed and quantified as in Fig. 1C. Error bars indicate standard deviation of three independent experiments. Statistical significance was determined by an unpaired t-test: **p<.01.

References

    1. Levine B, Klionsky DJ. Development by self-digestion: Molecular mechanisms and biological functions of autophagy. Dev Cell. 2004;6:463–477. - PubMed
    1. Suzuki K, Ohsumi Y. Molecular machinery of autophagosome formation in yeast, saccharomyces cerevisiae. FEBS Lett. 2007;581:2156–2161. - PubMed
    1. Mizushima N, Yamamoto A, Matsui M, Yoshimori T, Ohsumi Y. In vivo analysis of autophagy in response to nutrient starvation using transgenic mice expressing a fluorescent autophagosome marker. Mol Biol Cell. 2004;15:1101–1111. - PMC - PubMed
    1. Kanzawa T, Zhang L, Xiao L, Germano IM, Kondo Y, Kondo S. Arsenic trioxide induces autophagic cell death in malignant glioma cells by upregulation of mitochondrial cell death protein BNIP3. Oncogene. 2005;24:980–991. - PubMed
    1. Reef S, Zalckvar E, Shifman O, Bialik S, Sabanay H, Oren M, Kimchi A. A short mitochondrial form of p19ARF induces autophagy and caspase-independent cell death. Mol Cell. 2006;22:463–475. - PubMed

Publication types

Grants and funding

LinkOut - more resources