. 2008 Jan;40(1):83-9.
doi: 10.1038/ng.2007.47. Epub 2007 Dec 2.

Polymorphism at the TNF superfamily gene TNFSF4 confers susceptibility to systemic lupus erythematosus

Affiliations

Polymorphism at the TNF superfamily gene TNFSF4 confers susceptibility to systemic lupus erythematosus

Deborah S Cunninghame Graham et al. Nat Genet. 2008 Jan.

Abstract

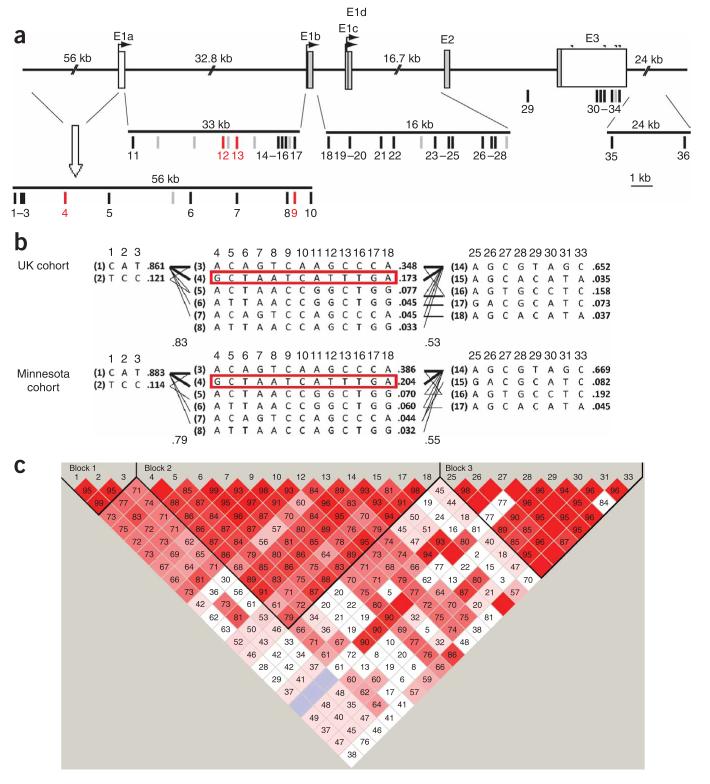
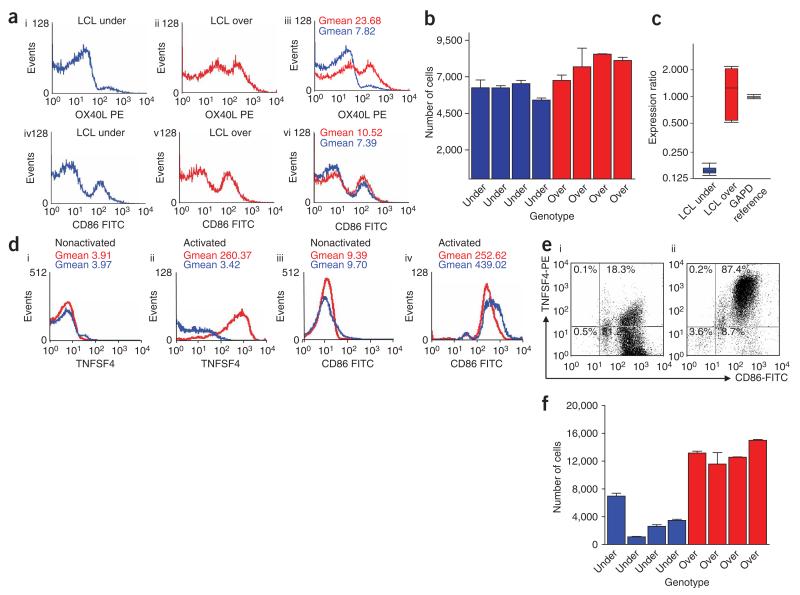
Systemic lupus erythematosus (SLE) is a multisystem complex autoimmune disease of uncertain etiology (OMIM 152700). Over recent years a genetic component to SLE susceptibility has been established. Recent successes with association studies in SLE have identified genes including IRF5 (refs. 4,5) and FCGR3B. Two tumor necrosis factor (TNF) superfamily members located within intervals showing genetic linkage with SLE are TNFSF4 (also known as OX40L; 1q25), which is expressed on activated antigen-presenting cells (APCs) and vascular endothelial cells, and also its unique receptor, TNFRSF4 (also known as OX40; 1p36), which is primarily expressed on activated CD4+ T cells. TNFSF4 produces a potent co-stimulatory signal for activated CD4+ T cells after engagement of TNFRSF4 (ref. 11). Using both a family-based and a case-control study design, we show that the upstream region of TNFSF4 contains a single risk haplotype for SLE, which is correlated with increased expression of both cell-surface TNFSF4 and the TNFSF4 transcript. We hypothesize that increased expression of TNFSF4 predisposes to SLE either by quantitatively augmenting T cell-APC interaction or by influencing the functional consequences of T cell activation via TNFRSF4.


Figures

Figure 1
Figure 1
Gene structure, haplotypic architecture and haplotype-TDT analysis in TNFSF4. (a) Human TNFSF4 consists of three exons. The translated exons are illustrated as gray boxes and the 5′ and 3′ UTRs as black boxes. The four potential poly(A) signals in the 3′ UTR are denoted by asterisks. In the diagram the SNPs used in the analysis have been recoded as numbers from 1 to 36: SNP 1 (rs10798267), SNP 2 (rs12118748), SNP 3 (rs4916318), SNP 4 (rs10912580), SNP 5 (rs844665), SNP 6 (rs844654), SNP 7 (rs844648), SNP 8 (rs2795288), SNP 9 (rs12039904), SNP 10 (rs844644), SNP 11 (rs844643), SNP 12 (rs2205960), SNP 13 (rs1234317), SNP 14 (rs3861953), SNP 15 (rs7535152), SNP 16 (rs1234315), SNP 17 (rs1234314), SNP 18 (rs3850641), SNP 25 (rs7518045), SNP 26 (rs6661173), SNP 27 (rs4113832), SNP 28 (rs7513384), SNP 29 (rs3861950), SNP 30 (171420977C<A), SNP 31 (rs7514229) and SNP 33 (rs3900307) as in Supplementary Table 2 online. The markers that failed quality control are place-marked in the sequence by gray lines. SNPs 4 (rs10912580), 9 (rs12039904), 12 (rs2205960) and 13 (rs1234317) are shown in red because they have overtransmitted minor alleles that tag overtransmitted haplotypes. (b) The haplotype block structure across TNFSF4 constructed from 413 European Caucasian parent-proband trios in the UK study cohort and in 262 US Minnesota parent-proband trios. There are three haplotype blocks across the gene. The haplotypes are numbered on the left of each haplotype in brackets from 1–13, with the haplotype frequencies shown to the right of each haplotype. Only haplotypes with a frequency of greater than 2.5% are shown. The SNP numbers across the top of the haplotypes correspond to those in the gene diagram. The red-boxed haplotypes are those showing overtransmission in both populations. (c) LD D′ prime chart from Haploview that summarizes the pattern of LD in the UK SLE families as a colored plot. Bright red represents regions of high pairwise D′, and white represents regions of low pairwise D′. The numbers in the boxes are the pairwise D′ values.
Figure 2
Figure 2
SLE susceptibility alleles are associated with an increase in TNFSF4 expression. (a) Histograms of CD40L anti-IgD-activated EBV-LCL cells showing expression of TNFSF4 ((i), (ii) and (iii)) and CD86 ((iv), (v) and (vi)) for representative samples that were homozygous for the either the undertransmitted susceptibility haplotype (LCL under, (i) and (iv); shown in blue) and for the overtransmitted haplotype (LCLover, (ii) and (v); shown in red), respectively. The geometric mean (Gmean) values of the fluorescent intensity are shown for each marker. The data presented are from one of two independent experiments, with similar results on the same cell lines. (b) The bar chart shows the numbers of CD40L and anti-IgD-stimulated cells in eight different homozygous cell lines (four LCL under and four LCL over). Each bar represents the mean of two independent replicates. (c) By carrying out quantification by qRT-PCR of TNFSF4 mRNA in two LCL-under and three LCL-over cell lines and pairwise analysis by REST, we generated a whisker box-plot representation of the variation between TNFSF4 transcript levels. LCL-over samples, which carry SLE-susceptibility alleles, were associated with a 6.7-fold increase in RNA expression (P = 0.008). TNFSF4 expression was normalized to GAPD mRNA expression in the same sample. The bars indicate the relative TNFSF4 expression in three independent replicates for each sample, ± s.d. (d) Overlaid histograms showing TNFSF4 expression (i and ii) and CD86 expression (iii and iv) in CD40L/anti-IgD–stimulated and unstimulated PBLs. These PBLs were taken from UK SLE probands that were homozygous for the undertransmitted haplotype (shown in blue) and for the overtransmitted haplotype (shown in red). The Gmean values presented are shown for the cell-surface markers in two individuals. (e) Representative FACS plots of stimulated PBLs taken from probands expressing (i) the undertransmitted haplotype and (ii) the overtransmitted haplotype. The percentage of CD86+TNFSF4+ cells within the activated cell population is indicated in the upper left quadrant. Cells were designated TNFSF4-positive if TNFSF4 expression fell within background staining compared to a mouse IgG1 negative control mAb (MOPC 31C, Ancell). (f) The numbers of TNFSF4-positive PBLs taken from eight SLE-affected probands (four homozygotes for each of the over- and undertransmitted haplotypes), 48 h after CD40L- anti-IgD stimulation. Each bar represents the mean of two independent replicates.

Similar articles

Cited by

References

    1. Vyse TJ, Todd JA. Genetic analysis of autoimmune disease. Cell. 1996;85:311–318. - PubMed
    1. Deapen D, et al. A revised estimate of twin concordance in systemic lupus erythematosus. Arthritis Rheum. 1992;35:311–318. - PubMed
    1. Forabosco P, et al. Meta-analysis of genome-wide linkage studies of systemic lupus erythematosus. Genes Immun. 2006;7:609–614. - PubMed
    1. Graham RR, et al. A common haplotype of interferon regulatory factor 5 (IRF5) regulates splicing and expression and is associated with increased risk of systemic lupus erythematosus. Nat. Genet. 2006;38:550–555. - PubMed
    1. Cunninghame Graham DS, et al. Association of IRF5 in UK SLE families identifies a variant involved in polyadenylation. Hum. Mol. Genet. 2007;16:579–591. - PMC - PubMed

Publication types