. 2007 Dec;8(12):1135-41.
doi: 10.1038/sj.embor.7401117.

Towards completion of the Earth's proteome

Affiliations

Towards completion of the Earth's proteome

Carolina Perez-Iratxeta et al. EMBO Rep. 2007 Dec.

Abstract

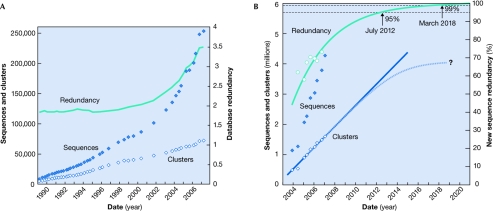
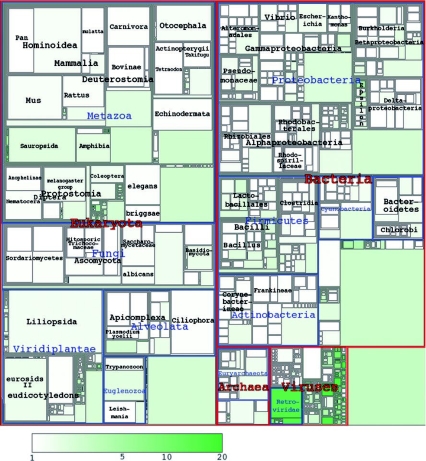
New protein sequences are deposited in databases at an accelerating pace; however, many of these are homologous to known proteins and could be considered redundant. If all historical releases of the protein database are analysed using the original sequence-clustering procedure described here, the fraction of newly sequenced proteins that are redundant is increasing. We interpret this as an indication that the sequencing of the Earth's proteome--the complete set of proteins on Earth--is approaching completion. We estimate the approximate size of the Earth's proteome to be 5 million sequences, most of which will be identified during the next 5 years. As the Earth's proteome nears completion, cluster analysis of the protein database will become essential to identify under-explored taxa to which future sequencing efforts should be directed and to focus research on protein families without experimental characterization.


Figures

Figure 1
Figure 1
Analysis of sequencing trends. (A) Historical evolution of the SwissProt database. Filled diamonds represent the number of sequences and open diamonds represent the number of sequence clusters. The continuous line is the database redundancy, which is calculated as sequences divided by clusters. Although sequences are added at increasing speed, the number of clusters increases linearly. As a result, the database redundancy increases. (B) Extrapolation of sequencing trends in UniRef100. Filled diamonds represent the number of sequences in UniRef100, open diamonds represent the number of sequence clusters (the cluster data can be adjusted to a line) and open circles represent the percentage of sequences new to a version of UniRef100 that clustered with sequences present in the previous version of the database. The redundancy data can be adjusted to an asymptotic function of the form g(x) = 56 × (1 − exp(bx)) + 44 for b = –0.0235735, where x is the number of months since release of UniRef100 version 1 (December 2003). Redundancy of new sequences at 95% is expected for the year 2012, and at 99% for 2018. A high estimate of 5 million sequences is proposed as the size of the Earth's proteome, assuming that the discovery of new protein clusters will start to slow (discontinuous line with a question mark).
Figure 2
Figure 2
Taxonomic distribution of all protein clusters from UniRef100. Treemap visualization (Shneiderman, 1992) of the taxonomic distribution of the 1.35 million clusters obtained by clustering UniRef100 release 8.5 (September 2006). The size of the boxes is proportional to the number of clusters at that taxonomic node; the colour intensity indicates the average cluster size (from 1, white, to 20, dark green, in a logarithmic scale). The treemap was generated from the full list of all clusters. For each cluster, the most general taxonomic node in common was identified. The aggregate number of nodes was then calculated for each position in the taxonomic tree. The 1,000 taxonomic nodes with the highest cumulative count—all clusters at that node and below—were selected for representation on the treemap. To simplify the diagram, only those taxonomic nodes that were 90% smaller than their closest represented ancestor node were shown. The resulting set of taxonomic nodes was rendered using a modified version of Treemap-0.2. To emphasize interesting features of the diagram, labels were added manually. A similar graph is available online from http://www.ogic.ca/projects/clusters/ in which taxa labels can be observed by mouse hovering, and boxes are linked to the corresponding taxonomic database entry at the National Center for Biotechnology Information. All underlying data are provided in Table S1 available at: http://www.ogic.ca/projects/clusters/sorted_allcluster_taxonomy_8.5.zip.
Figure 3
Figure 3
Sequence alignment of members of cluster UniRef100_Q28WW9. The cluster UniRef100_Q28WW9 contains 32 proteins including the products of human C4orf34, mouse 1110003E01Rik and fruit fly AT28250p hypothetical genes, as well as proteins from other metazoa. A PSI-BLAST search of the NCBI's protein database using the UniRef100_Q28WW9 sequence (cluster leader, from Drosophila pseudoobscura) converged to a similar set of sequences. The 32 members of cluster UniRef100_Q28WW9 were aligned using ClustalW (Thompson et al, 1994). Matches to a transmembrane region (predicted using Phobius; Kall et al, 2004) and a carboxy-terminal proline-rich region (obtained using BiasViz; Huska et al, 2007) are indicated at the bottom with a blue and an orange bar, respectively. Conserved cysteines—indicated with red triangles—can be observed in the N-terminal region, whereas there are none in the C-terminal region. This suggests that the N terminus of the protein is extracellular and the C terminus cytoplasmic, a conclusion reached also by the Phobius server. Current versions of the databases (June 2007) did not include specific functional or bibliographic information for any member of this cluster. Thus, this family, which represents a small transmembrane protein conserved in metazoans, constitutes a potentially interesting target of experimental verification. NCBI, National Center for Biotechnology Information.
None
Carolina Perez-Iratxeta
None
Gareth Palidwor
None
Miguel A. Andrade-Navarro

Similar articles

Cited by

References

    1. Adam GC, Sorensen EJ, Cravatt BF (2002) Chemical strategies for functional proteomics. Mol Cell Proteomics 1: 781–790 - PubMed
    1. Adams MD, Dubnick M, Kerlavage AR, Moreno R, Kelley JM, Utterback TR, Nagle JW, Fields C, Venter JC (1992) Sequence identification of 2,375 human brain genes. Nature 355: 632–634 - PubMed
    1. Bairoch A, Boeckmann B (1991) The SWISS-PROT protein sequence data bank. Nucleic Acids Res 19 (Suppl): 2247–2249 - PMC - PubMed
    1. Bairoch A et al. (2007) The Universal Protein Resource (UniProt). Nucleic Acids Res 35: D193–D197 - PMC - PubMed
    1. Casari G, Andrade MA, Bork P, Boyle J, Daruvar A, Ouzounis C, Schneider R, Tamames J, Valencia A, Sander C (1995) Challenging times for bioinformatics. Nature 376: 647–648 - PubMed

Publication types