

Inhibitors of histone deacetylase (HDAC) restore the p53 pathway in neuroblastoma cells
- PMID: 18059320
- PMCID: PMC2259214
- DOI: 10.1038/sj.bjp.0707608
Inhibitors of histone deacetylase (HDAC) restore the p53 pathway in neuroblastoma cells
Abstract
Background and purpose: Inhibitors of histone deacetylase (HDAC) are emerging as a promising class of anti-cancer drugs, but a generic deregulation of transcription in neoplastic cells cannot fully explain their therapeutic effects. In this study we evaluated alternative molecular mechanisms by which HDAC inhibitors could affect neuroblastoma viability.
Experimental approach: Effects of HDAC inhibitors on survival of the I-type SK-N-BE and the N-type NB SH-SY5Y neuroblastoma cell lines were assessed by the MTT assay. Molecular pathways leading to this were examined by western blot, confocal microscopy and cytofluorometry. The mRNA levels of apoptotic mediators were assessed semi-quantitatively by RT-PCR. Tumour-suppressor p53 trans activity was assessed in EMSA experiments. HDAC inhibitors were also studied in cells subjected to plasmid-based p53 interference (p53i).
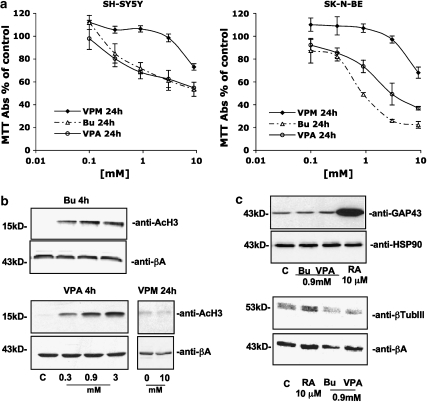
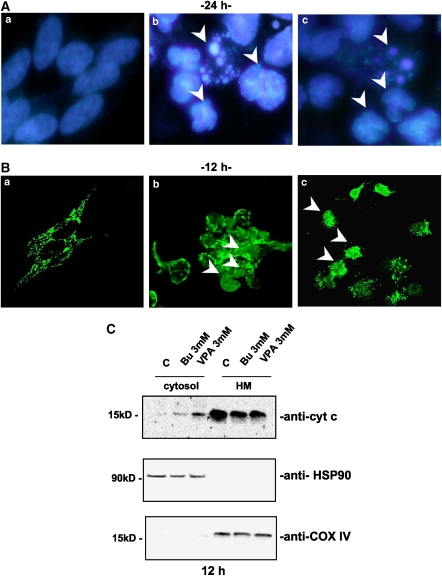
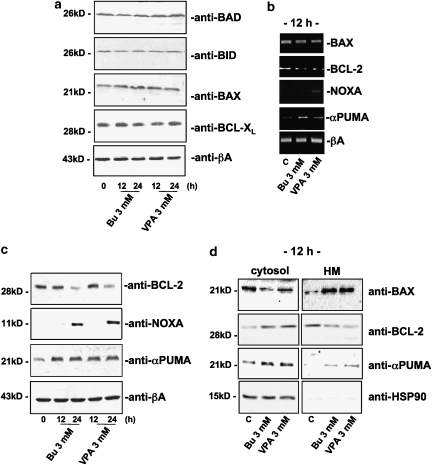
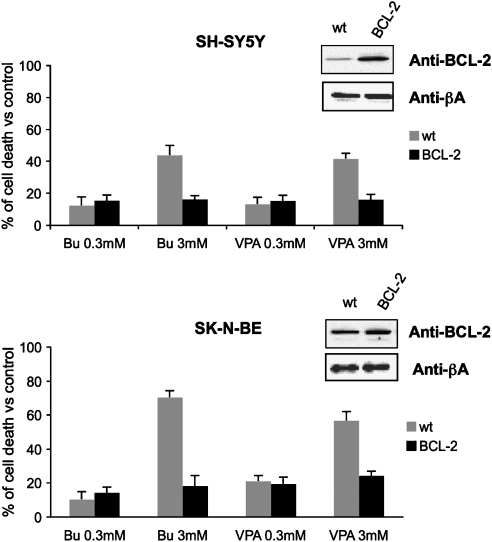
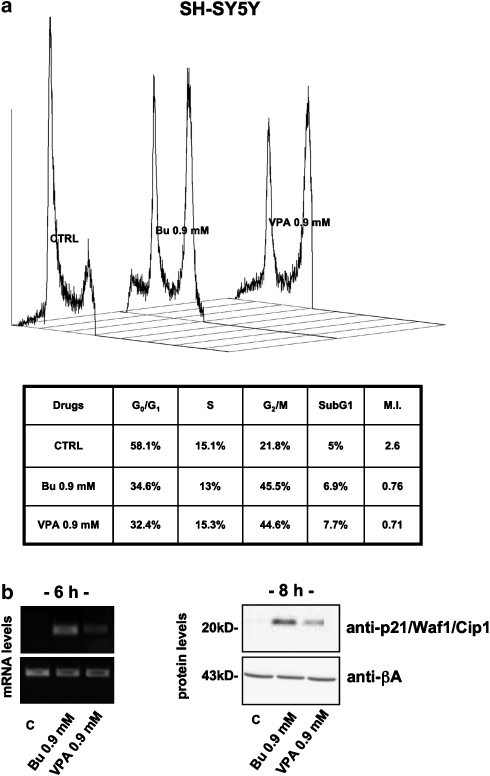
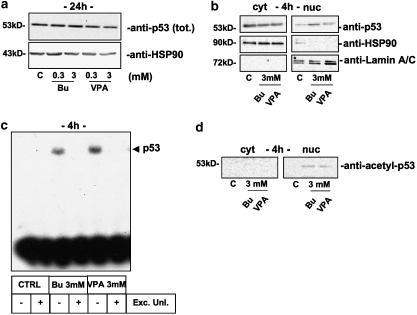
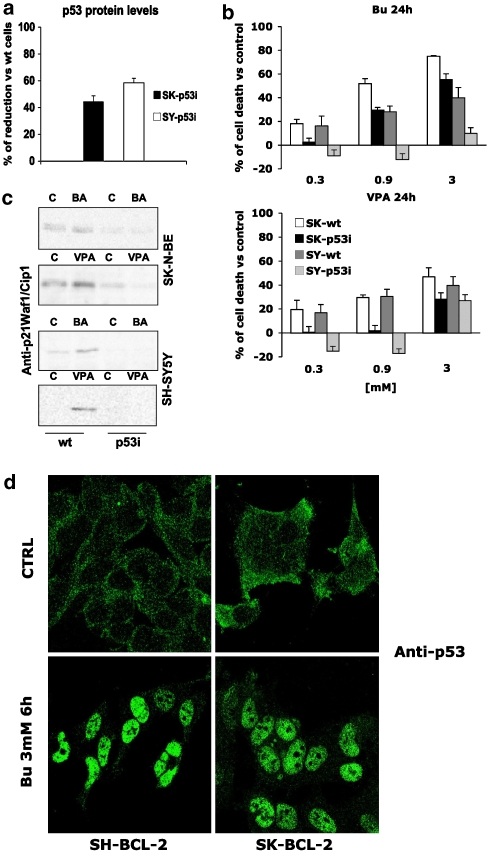
Key results: HDAC inhibitors induced cell death via the mitochondrial pathway of apoptosis with recruitment of Bcl-2 family members. Bcl-2 overexpression rendered neuroblastoma cells resistant to HDAC inhibitor treatment. Low concentrations of HDAC inhibitors (0.9 mM) caused a G(2) cell-cycle arrest and a marked upregulation of the p21/Waf1/Cip1 protein. HDAC inhibitors also activate the p53 protein via hyper-acetylation and nuclear re-localization, without affecting its protein expression. Accordingly, HDAC inhibitor-induced cell-killing and p21/Waf1/Cip1 upregulation is impaired in p53i-cells.
Conclusions and implications: In neuroblastoma cells, HDAC inhibitors may overcome the resistance to classical chemotherapeutic drugs by restoring the p53 tumour-repressor function via its hyper-acetylation and nuclear migration, events usually impaired in such tumours. In neuroblastoma cells, HDAC inhibitors are not able to induce p21/Waf1/Cip1 in the absence of a functional p53.
Figures
Similar articles
-
p21Waf1/Cip1 is a common target induced by short-chain fatty acid HDAC inhibitors (valproic acid, tributyrin and sodium butyrate) in neuroblastoma cells.Oncol Rep. 2005 Jun;13(6):1139-44. Oncol Rep. 2005. PMID: 15870934
-
Histone deacetylase inhibitors: signalling towards p21cip1/waf1.Int J Biochem Cell Biol. 2007;39(7-8):1367-74. doi: 10.1016/j.biocel.2007.03.001. Epub 2007 Mar 7. Int J Biochem Cell Biol. 2007. PMID: 17412634 Review.
-
Novel histone deacetylase inhibitor CG200745 induces clonogenic cell death by modulating acetylation of p53 in cancer cells.Invest New Drugs. 2012 Apr;30(2):435-42. doi: 10.1007/s10637-010-9568-2. Epub 2010 Oct 27. Invest New Drugs. 2012. PMID: 20978925
-
Synergistic efficacy of sorafenib and genistein in growth inhibition by down regulating angiogenic and survival factors and increasing apoptosis through upregulation of p53 and p21 in malignant neuroblastoma cells having N-Myc amplification or non-amplification.Invest New Drugs. 2010 Dec;28(6):812-24. doi: 10.1007/s10637-009-9324-7. Epub 2009 Sep 24. Invest New Drugs. 2010. PMID: 19777160 Free PMC article.
-
Targeting histone deacetylases in neuroblastoma.Curr Pharm Des. 2009;15(4):436-47. doi: 10.2174/138161209787315774. Curr Pharm Des. 2009. PMID: 19199971 Review.
Cited by
-
The antiparasitic clioquinol induces apoptosis in leukemia and myeloma cells by inhibiting histone deacetylase activity.J Biol Chem. 2013 Nov 22;288(47):34181-34189. doi: 10.1074/jbc.M113.472563. Epub 2013 Oct 10. J Biol Chem. 2013. PMID: 24114842 Free PMC article. Clinical Trial.
-
TdIF1: a putative oncogene in NSCLC tumor progression.Signal Transduct Target Ther. 2018 Oct 19;3:28. doi: 10.1038/s41392-018-0030-9. eCollection 2018. Signal Transduct Target Ther. 2018. PMID: 30345081 Free PMC article.
-
Discovery of spirooxindole-derived small-molecule compounds as novel HDAC/MDM2 dual inhibitors and investigation of their anticancer activity.Front Oncol. 2022 Aug 4;12:972372. doi: 10.3389/fonc.2022.972372. eCollection 2022. Front Oncol. 2022. PMID: 35992773 Free PMC article.
-
Chemical Genetics Screen Identifies Epigenetic Mechanisms Involved in Dopaminergic and Noradrenergic Neurogenesis in Zebrafish.Front Genet. 2020 Feb 25;11:80. doi: 10.3389/fgene.2020.00080. eCollection 2020. Front Genet. 2020. PMID: 32158467 Free PMC article.
-
The HDAC inhibitor panobinostat (LBH589) exerts in vivo anti-leukaemic activity against MLL-rearranged acute lymphoblastic leukaemia and involves the RNF20/RNF40/WAC-H2B ubiquitination axis.Leukemia. 2018 Feb;32(2):323-331. doi: 10.1038/leu.2017.216. Epub 2017 Jul 10. Leukemia. 2018. PMID: 28690313
References
-
- Adida C, Berrebi D, Peuchmaur M, Reyes-Mugica M, Altieri DC. Anti-apoptosis gene, survivin, and prognosis of neuroblastoma. Lancet. 1998;351:882–883. - PubMed
-
- Ammanamanchi S, Freeman JW, Brattain MG. Acetylated sp3 is a transcriptional activator. J Biol Chem. 2003;278:35775–35780. - PubMed
-
- Barry MA, Behnke CA, Eastman A. Activation of programmed cell death (apoptosis) by cisplatin, other anticancer drugs, toxins and hyperthermia. Biochem Pharmacol. 1990;40:2353–2362. - PubMed
-
- Bowden CL. Valproate. Bipolar Disord. 2003;5:189–202. - PubMed
-
- Ciccarone V, Spengler BA, Meyers MB, Biedler JL, Ross RA. Phenotypic diversification in human neuroblastoma cells: expression of distinct neural crest lineages. Cancer Res. 1989;49:219–225. - PubMed
Publication types
MeSH terms
Substances
LinkOut - more resources
Full Text Sources
Other Literature Sources
Medical
Research Materials
Miscellaneous
