

Analysis of observer performance in unknown-location tasks for tomographic image reconstruction
- PMID: 18059919
- PMCID: PMC3013346
- DOI: 10.1364/josaa.24.000b99
Analysis of observer performance in unknown-location tasks for tomographic image reconstruction
Abstract
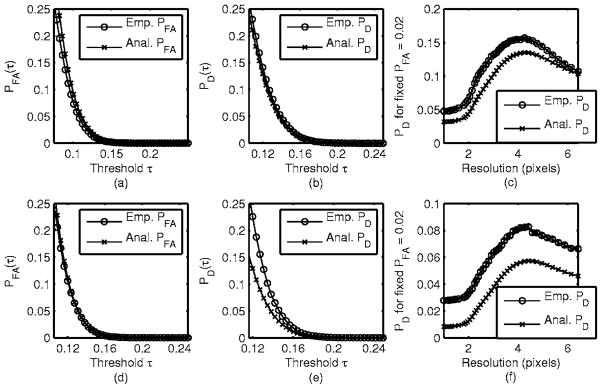
Our goal is to optimize regularized image reconstruction for emission tomography with respect to lesion detectability in the reconstructed images. We consider model observers whose decision variable is the maximum value of a local test statistic within a search area. Previous approaches have used simulations to evaluate the performance of such observers. We propose an alternative approach, where approximations of tail probabilities for the maximum of correlated Gaussian random fields facilitate analytical evaluation of detection performance. We illustrate how these approximations, which are reasonably accurate at low probability of false alarm operating points, can be used to optimize regularization with respect to lesion detectability.
Figures
References
-
- Hansen PC, O’Leary DP. The use of the L-curve in the regularization of discrete ill-posed problems. SIAM (Soc Ind Appl Math) J Sci Stat Comput. 1993;14:1487–1506.
-
- Vogel CR. Non-convergence of the L-curve regularization parameter selection method. Inverse Probl. 1996;12:535–547.
-
- Lusted LB. Signal detectability and medical decision-making. Science. 1971;171:1217–1219. - PubMed
-
- Metz CE. Basic principles of ROC analysis. Semin Nucl Med. 1978;8:283–298. - PubMed
-
- Chesters MS. Human visual perception and ROC methodology in medical imaging. Phys Med Biol. 1992;37:1433–1484. - PubMed
Publication types
MeSH terms
Grants and funding
LinkOut - more resources
Full Text Sources
