. 2007 Dec;117(12):4022-33.
doi: 10.1172/JCI32829.

Prolonged wakefulness induces experience-dependent synaptic plasticity in mouse hypocretin/orexin neurons

Affiliations

Prolonged wakefulness induces experience-dependent synaptic plasticity in mouse hypocretin/orexin neurons

Yan Rao et al. J Clin Invest. 2007 Dec.

Abstract

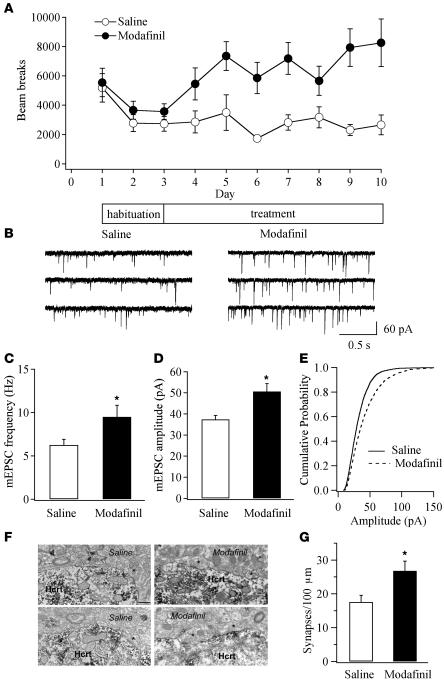
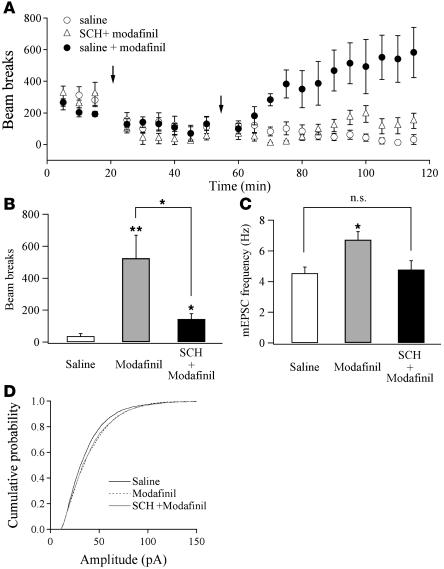
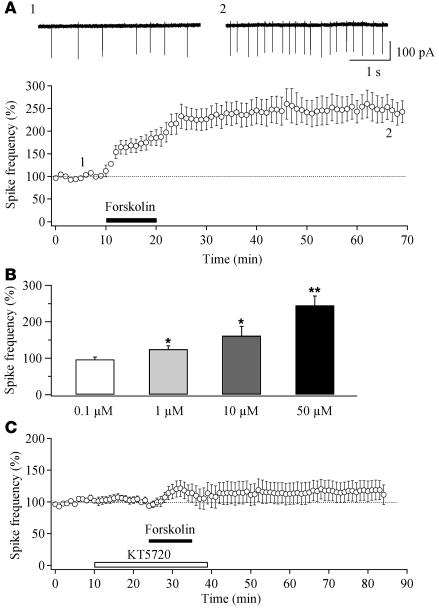
Sleep is a natural process that preserves energy, facilitates development, and restores the nervous system in higher animals. Sleep loss resulting from physiological and pathological conditions exerts tremendous pressure on neuronal circuitry responsible for sleep-wake regulation. It is not yet clear how acute and chronic sleep loss modify neuronal activities and lead to adaptive changes in animals. Here, we show that acute and chronic prolonged wakefulness in mice induced by modafinil treatment produced long-term potentiation (LTP) of glutamatergic synapses on hypocretin/orexin neurons in the lateral hypothalamus, a well-established arousal/wake-promoting center. A similar potentiation of synaptic strength at glutamatergic synapses on hypocretin/orexin neurons was also seen when mice were sleep deprived for 4 hours by gentle handling. Blockade of dopamine D1 receptors attenuated prolonged wakefulness and synaptic plasticity in these neurons, suggesting that modafinil functions through activation of the dopamine system. Also, activation of the cAMP pathway was not able to further induce LTP at glutamatergic synapses in brain slices from mice treated with modafinil. These results indicate that synaptic plasticity due to prolonged wakefulness occurs in circuits responsible for arousal and may contribute to changes in the brain and body of animals experiencing sleep loss.


Figures

Figure 1
Figure 1. LTP of excitatory synapses on hypocretin/orexin neurons following an acute exposure to prolonged wakefulness.
(A) Modafinil (100 mg/kg) induces a long-lasting increment of locomotor activity in mice. Each point represents averaged beam breaks within a block of 5 minutes from all animals in each group during our experiments. The arrow indicates injection of modafinil or saline. (B) Sample traces of mEPSCs recorded in hypocretin/orexin neurons from saline- and modafinil-treated mice. (C) Mean frequency of mEPSCs recorded in hypocretin/orexin neurons 0, 1, and 2 hours after the injection of saline or modafinil. *P < 0.05, Student’s t test. (DF) Cumulative probability of the amplitude of mEPSCs recorded in all neurons from saline- and modafinil-treated mice 0, 1, and 2 hours after the injection. (D) Saline, 1,518 events; modafinil, 1,557 events. (E) Saline, 4,510 events; modafinil, 2,753 events. (F) Saline, 3,250 events; modafinil, 3,942 events. (G and H) Relative contributions of AMPARs and NMDARs on evoked EPSCs recorded in hypocretin/orexin neurons from mice treated with saline and modafinil. (G) Sample traces of evoked EPSCs carried by AMPARs and NMDARs in hypocretin/orexin neurons from mice treated with saline (left) and modafinil (right). (H) Pooled data of the AMPAR/NMDAR ratio from all neurons in saline- (n = 10) or modafinil-treated mice (n = 10) 1 hour after the injection. *P < 0.05, Student’s t test.
Figure 2
Figure 2. Experience-dependent synaptic plasticity in mice chronically exposed to prolonged wakefulness.
(A) Measurement of locomotor activity indicates development of behavioral sensitization in mice chronically treated with modafinil. Each point represents averaged beam breaks in a 30-minute session from all mice in each group. (B) Sample traces of mEPSCs recorded in hypocretin/orexin neurons from mice chronically treated with saline or modafinil 1 day after the completion of the 7-day treatment. (C) Pooled data from all recorded neurons in control mice and mice chronically exposed to prolonged wakefulness indicate the potentiated frequency of mEPSCs in modafinil-treated mice. *P < 0.05, Student’s t test. (D) Pooled data from all recorded neurons in control mice and mice chronically exposed to wakefulness indicate the potentiated amplitude of mEPSCs in modafinil-treated mice. *P < 0.05, Student’s t test. (E) Cumulative probability of the amplitude of mEPSCs recorded from mice treated with modafinil (4,163 events) or saline (3,232 events). The rightward shift of cumulative distribution of mEPSC amplitude in the modafinil-treated group was significant (P < 0.001, Kolmogorov-Smirnov test). (F and G) Chronic treatment with modafinil increases the number of asymmetric (putative excitatory) synapses on perikarya containing hypocretin/orexin (Hcrt). (F) Electron micrographs of asymmetric (putative excitatory) synapses on hypocretin/orexin-containing perikarya in saline- (left) or modafinil-treated mice (right). Presynaptic terminals are indicated by the asterisk. Scale bar: 1 μm. (G) Bar graph shows the numbers of asymmetric synapses per 100 μm perikaryal membrane of hypocretin neurons in saline- or modafinil- treated mice. *P < 0.05.
Figure 3
Figure 3. LTP of excitatory synapses on hypocretin/orexin neurons following SD.
(A) Sample traces of mEPSCs recorded in hypocretin/orexin neurons from control and SD mice. SD mice were deprived of sleep for 4 hours through gentle handling. (B) The mean frequency of mEPSCs recorded in hypocretin/orexin neurons from control and SD mice. *P < 0.05, Student’s t test. (C) The mean amplitude of mEPSC events recorded in hypocretin/orexin neurons from control and SD mice. *P < 0.05, Student’s t test. (D) Cumulative probability of the amplitude of mEPSC events recorded in hypocretin/orexin neurons from control (1,518 events) and SD mice (1,557 events). (E and F) Relative contributions of AMPARs and NMDARs on evoked EPSCs recorded in hypocretin/orexin neurons from control and SD mice. (E) Sample traces of evoked EPSCs carried by AMPARs and NMDARs recorded in hypocretin/orexin neurons from control (left) and SD mice (right). (F) Pooled data of the AMPAR/NMDAR ratio recorded from all hypocretin/orexin neurons from control (n = 7) and SD mice (n = 7) are presented. *P < 0.05, Student’s t test.
Figure 4
Figure 4. Blockade of D1 receptor–mediated pathways attenuates modafinil-induced effects on wakefulness and synaptic plasticity.
(A) Time course of locomotor activity shows that pretreatment of a selective D1 receptor antagonist SCH 23390 (SCH) attenuates modafinil effects on locomotor activity. Each point represents averaged beam breaks within a block of 5 minutes detected from all animals in each group. The first arrow indicates the injection of SCH 23390 or saline. The second arrow indicates the injection of modafinil or saline. (B) Mean beam breaks per 5 minutes of the last 30-minute session of our experiment monitored from all 3 groups. *P < 0.05; **P < 0.01. (C) The mean frequency of mEPSCs recorded in hypocretin/orexin neurons from all 3 groups. *P < 0.05, ANOVA; NS: P > 0.05. (D) Cumulative probability of the amplitude of mEPSCs recorded in hypocretin/orexin neurons from mice treated with saline (2,829 events), modafinil (3,140 events), and SCH 23390 plus modafinil (2,725 events).
Figure 5
Figure 5. Forskolin induces a long-lasting potentiation of spike generation in hypocretin/orexin neurons.
(A) Time course of For-LTP of action potentials in hypocretin/orexin neurons. Representative traces of spikes (action currents) recorded extracellularly before and 1 hour after the application of forskolin were taken at the times indicated on the graph. The black bar indicates the application of forskolin. (B) Bar graph indicates the dose-dependence of For-LTP in hypocretin/orexin neurons. Percentage changes in spike frequency recorded 30 minutes after the withdrawal of forskolin at 4 different doses are shown. *P < 0.05; **P < 0.01. (C) Time course of spike frequency indicates that inhibition of PKA eliminates For-LTP of action potentials in hypocretin/orexin neurons (P > 0.05, paired Student’s t test).
Figure 6
Figure 6. LTP of glutamatergic synapses on hypocretin/orexin neurons elicited by application of forskolin.
(A) Sample traces (left) and single events (right) of mEPSCs recorded in hypocretin/orexin neurons before and 30 minutes after the application of forskolin. (B) Time course of the averaged frequency of mEPSCs from all tested neurons is shown on the left, and pooled data of the frequency of mEPSCs from all neurons before and 30 minutes after the application of forskolin are shown on the right. **P < 0.01. (C) Time course of the averaged amplitude of mEPSCs recorded in our experiments is shown on the left. Right: Cumulative probability of mEPSC amplitude recorded before (831 events) and 30 minutes after the application of forskolin (1,566 events) (P < 0.001, Kolmogorov-Smirnov test). (D) LTP of the frequency of mEPSCs induced by forskolin is intact in the presence of PKI6-22 in the pipette solution. Left: Time course of mEPSC frequency during the postsynaptic application of PKI6-22. Right: Pooled data of mEPSC frequency from all tested neurons before and 30 minutes after the application of forskolin. **P < 0.01, paired Student’s t test. (E) LTP of mEPSC amplitude is blocked when PKI6-22 is present in pipette solution. Left: Time course of mEPSC amplitude recorded in our experiments during the postsynaptic application of PKI6-22. Right: Cumulative probability of mEPSC amplitude recorded before (469 events) and 30 minutes after the application of forskolin (1,100 events) when PKI6-22 was applied to postsynaptic neurons (P > 0.05, Kolmogorov-Smirnov test).
Figure 7
Figure 7. Occlusion of For-LTP in hypocretin/orexin neurons in mice exposed to prolonged wakefulness.
(A) Time courses indicate that For-LTP of mEPSC frequency existed in control and modafinil-treated mice. (B) Time courses indicate that For-LTP of mEPSC amplitude is significantly attenuated in modafinil-treated mice compared with control mice (P < 0.05, Student’s t test). (C and D) Cumulative probability of mEPSC amplitude detected before and 30 minutes after the treatment of forskolin in control (C) and modafinil-treated mice (D) confirms a significant enhancement after the treatment of forskolin (P < 0.001, Kolmogorov-Smirnov test). (C) Control, 1,101 events; forskolin treatment, 1,770 events. (D) Control, 1,282 events; forskolin treatment, 2,387 events. (EH) LTP of mEPSC frequency and amplitude triggered by forskolin is occluded in mice acutely exposed to modafinil. (E) LTP of mEPSC frequency is significantly attenuated in modafinil-treated compared with control mice (P < 0.05, Student’s t test). (F) LTP of mEPSC amplitude induced by forskolin (5 μM) exists in control mice but not in modafinil-treated mice. (G and H) Cumulative probability of mEPSC amplitude detected before and 30 minutes after the treatment with forskolin in control (G) and modafinil-treated mice (H). (G) A significant potentiation induced by forskolin is confirmed (P < 0.001, Kolmogorov-Smirnov test). Control: 1,124 events; forskolin treatment: 1,666 events. (H) No significant changes in mEPSC amplitude are detected after the treatment with forskolin (P > 0.05, Kolmogorov-Smirnov test). Control: 516 events; forskolin treatment: 723 events.
Figure 8
Figure 8. Occlusion of For-LTP in hypocretin/orexin neurons in mice repeatedly exposed to prolonged wakefulness.
(A) LTP of mEPSC frequency is attenuated in mice chronically treated with modafinil compared with saline-treated mice. (B) Pooled data from all tested neurons recorded 30 minutes after the application of forskolin demonstrate that LTP of mEPSC frequency induced by forskolin (50 μM) is significantly attenuated in mice repeatedly treated with modafinil compared with control mice. *P < 0.05. (C) Time course shows that LTP of mEPSC amplitude exists in control mice but not in modafinil-treated mice. (D) Pooled data from all tested neurons recorded 30 minutes after the application of forskolin demonstrate that LTP of mEPSC amplitude is blocked in mice repeatedly treated with modafinil. *P < 0.05, Student’s t test. (E) Cumulative probability of mEPSC amplitude detected before (476 events) and 30 minutes after the treatment of forskolin (793 events) in control mice confirms a significant enhancement after the treatment (P < 0.001, Kolmogorov-Smirnov test). (F) Cumulative probability of mEPSC amplitude detected before (527 events) and 30 minutes after the treatment of forskolin (1,296 events) in modafinil-treated mice confirms that there was no significant change in the amplitude of mEPSC after the treatment with forskolin (P > 0.05, Kolmogorov-Smirnov test).

Comment in

Similar articles

Cited by

References

    1. Siegel J.M. Clues to the functions of mammalian sleep. Nature. . 2005;437:1264–1271. - PMC - PubMed
    1. Tononi G., Cirelli C. Sleep function and synaptic homeostasis. Sleep Med. Rev. 2006;10:49–62. - PubMed
    1. Rechtschaffen A., Bergmann B.M., Everson C.A., Kushida C.A., Gilliland M.A. Sleep deprivation in the rat: X. Integration and discussion of the findings. Sleep. 1989;12:68–87. - PubMed
    1. Bonnet M.H., Arand D.L. Clinical effects of sleep fragmentation versus sleep deprivation. Sleep Med. Rev. 2003;7:297–310. - PubMed
    1. Durmer J.S., Dinges D.F. Neurocognitive consequences of sleep deprivation. Semin. Neurol. 2005;25:117–129. - PubMed

Publication types

MeSH terms