. 2007 Nov 21;1(2):e86.
doi: 10.1371/journal.pntd.0000086.

Host gene expression profiling of dengue virus infection in cell lines and patients

Affiliations

Host gene expression profiling of dengue virus infection in cell lines and patients

Joshua Fink et al. PLoS Negl Trop Dis. .

Abstract

Background: Despite the seriousness of dengue-related disease, with an estimated 50-100 million cases of dengue fever and 250,000-500,000 cases of dengue hemorrhagic fever/dengue shock syndrome each year, a clear understanding of dengue pathogenesis remains elusive. Because of the lack of a disease model in animals and the complex immune interaction in dengue infection, the study of host response and immunopathogenesis is difficult. The development of genomics technology, microarray and high throughput quantitative PCR have allowed researchers to study gene expression changes on a much broader scale. We therefore used this approach to investigate the host response in dengue virus-infected cell lines and in patients developing dengue fever.

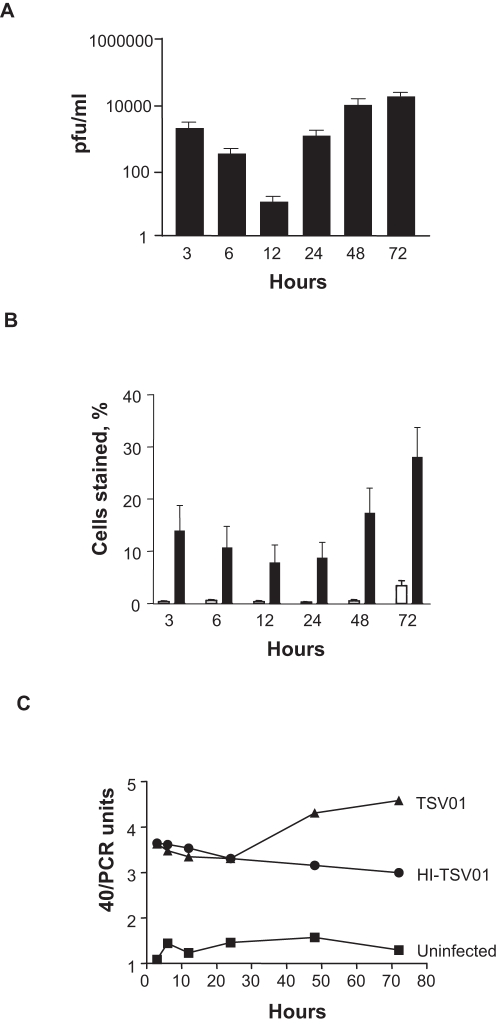
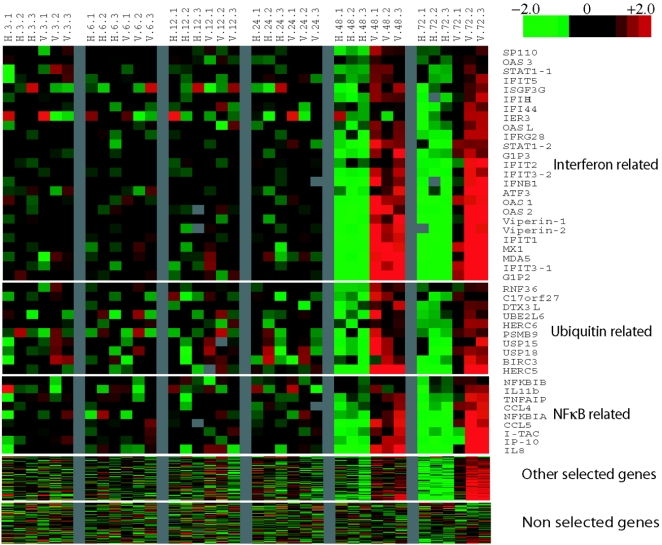
Methodology/principal findings: Using microarray and high throughput quantitative PCR method to monitor the host response to dengue viral replication in cell line infection models and in dengue patient blood samples, we identified differentially expressed genes along three major pathways; NF-kappaB initiated immune responses, type I interferon (IFN) and the ubiquitin proteasome pathway. Among the most highly upregulated genes were the chemokines IP-10 and I-TAC, both ligands of the CXCR3 receptor. Increased expression of IP-10 and I-TAC in the peripheral blood of ten patients at the early onset of fever was confirmed by ELISA. A highly upregulated gene in the IFN pathway, viperin, was overexpressed in A549 cells resulting in a significant reduction in viral replication. The upregulation of genes in the ubiquitin-proteasome pathway prompted the testing of proteasome inhibitors MG-132 and ALLN, both of which reduced viral replication.

Conclusion/significance: Unbiased gene expression analysis has identified new host genes associated with dengue infection, which we have validated in functional studies. We showed that some parts of the host response can be used as potential biomarkers for the disease while others can be used to control dengue viral replication, thus representing viable targets for drug therapy.


Conflict of interest statement

The authors have declared that no competing interests exist.

Figures

Figure 1
Figure 1. Dengue replication in HepG2 cells.
(A) HepG2 cells were infected with dengue virus TSV01 (MOI 10) for 3, 6, 12, 24, 48 and 72 hrs. Cell culture supernatants were collected and assayed for dengue virus by plaque assay. Plaque forming units per ml are expressed on a log scale as mean±s.e.m. where n = 4. (B) HepG2 cells were infected with dengue virus TSV01 (closed bars) or incubated with media alone (open bars). Percentage of cells staining positive for dengue virus E-protein by FACS are expressed as mean±s.e.m. where n = 3. (C) HepG2 cells were infected with dengue virus TSV01 (MOI 10) for 3, 6, 12, 24, 48 and 72 hrs. RNA was extracted and used to quantitate viral RNA copies by Real Time PCR. The copy number is represented by dividing the cycle detection threshold (Ct) value at the limit of detection (40) by the sample Ct value (40/PCR units). One representative result is shown.
Figure 2
Figure 2. Heat map of the microarray gene expression profile of HepG2 cells treated with live dengue virus TSV01 (V) or heat inactivated TSV01 (H) transcripts identified as being differentially expressed by SAM analysis.
Details on gene name, gene function, SAM statistics, and fold change for all 132 selected transcripts are given in Table S1. Colour intensity is derived from mean relative expression fold changes of dye swap results in comparison to universal reference (Strategene USA), red for upregulated, green for down regulated, black for no change, and grey for missing data. Time course (3, 6, 12, 24, 48, 72 hours post infection) and triplicate (.1, .2, .3) are indicated on the x axis and genes are grouped into three functional classes and clustered by expression profile on the y axis.
Figure 3
Figure 3. qPCR confirmed, common differentially expressed genes in HepG2, A549 cell lines and dengue patients.
(A) A network of direct interactions (highlighted by * in B, C & D) was identified by the MetaCore program. Arrow head indicates directional interaction. Green are positive, red are negative, grey are neutral or unknown. Blue symbols indicate protein, green ones receptor ligand, red ones transcription factors, yellow ones proteases and orange ones kinases or phosphatases. 32 confirmed genes cluster to three biological pathways; (B) NF-κB/chemokine-genes (C) Type I IFN-mediated and (D) the ubiquitin-proteasome system. The fold increases of genes significantly differentially expressed in patients and cell lines were combined to give a pooled mean (± s.e.m.) in order to grade their relative importance.
Figure 4
Figure 4. Culture supernatants of A549 and HepG2 cells infected with TSV01 (MOI 10) or heat-inactivated TSV-01 (HI-TSV01; MOI 10) for 72 hrs were analyzed for IP-10 (A) and I-TAC (B) by ELISA.
Results are expressed as mean±s.e.m. where n = 3–5. Significance (P<0.05) was determined by students t-test, comparing TSV01 to HI-TSV01 at each time point. Serum samples from dengue patients (n = 10) at first visit (1–2 days after fever onset), second visit (4–5 days after fever onset), convalescence and from non-dengue fever patients (n = 10) at the first visit (1–2 days after fever onset) were assayed for the presence of IP-10 (C) and I-TAC (D) by ELISA. Results are shown as a scatter plot with a bar indicating the mean.
Figure 5
Figure 5. The effect of viperin overexpression and proteasome inhibitors on viral growth.
(A) Wildtype (WT) and viperin overexpressing (Vip) A549 cells, with or without 12 hrs pre-treatment with IFNβ (500 U/ml), were infected with dengue virus TSV01 (MOI 1) for 48 hrs. Plaque forming units/ml in cell culture supernatant, as determined by plaque assay, are shown as mean (n = 3)±s.e.m. Significance (P<0.05) was determined by students t-test, comparing wild type A549 (WT) to viperin overexpressing cell (Vip) a P value of 0.00004 was obtained. (B) HepG2 cells were incubated with MG-132 (0.04 µM and 0.4 µM in DMSO) and ALLN (1 µM and 10 µM in DMSO) and DMSO alone for 2 hrs prior to infection with dengue virus TSV01 (MOI 10) for 48 hrs. Plaque forming units/ml in cell culture supernatant, as determined by plaque assay, are shown as mean (n = 3)±s.e.m. Significance (P<0.05) was determined by students t-test, comparing each treatment to DMSO alone. The cytotoxicity was measured in parallel using FDA (C).

References

    1. Rigau-Perez JG, Clark GG, Gubler DJ, Reiter P, Sanders EJ, et al. Dengue and dengue haemorrhagic fever. Lancet. 1998;352:971–977. - PubMed
    1. Vaughn DW, Green S, Kalayanarooj S, Innis BL, Nimmannitya S, et al. Dengue viremia titer, antibody response pattern, and virus serotype correlate with disease severity. J Infect Dis. 2000;181:2–9. - PubMed
    1. Mukhopadhyay S, Kuhn RJ, Rossmann MG. A structural perspective of the flavivirus life cycle. Nat Rev Microbiol. 2005;3:13–22. - PubMed
    1. Wu SJ, Grouard-Vogel G, Sun W, Mascola JR, Brachtel E, et al. Human skin Langerhans cells are targets of dengue virus infection. Nat Med. 2000;6:816–820. - PubMed
    1. Jessie K, Fong MY, Devi S, Lam SK, Wong KT. Localization of dengue virus in naturally infected human tissues, by immunohistochemistry and in situ hybridization. J Infect Dis. 2004;189:1411–1418. - PubMed

Publication types

MeSH terms