. 2007 Dec;13(6):812-27.
doi: 10.1016/j.devcel.2007.10.015.

Stabilization of overlapping microtubules by fission yeast CLASP

Affiliations

Stabilization of overlapping microtubules by fission yeast CLASP

Scott V Bratman et al. Dev Cell. 2007 Dec.

Abstract

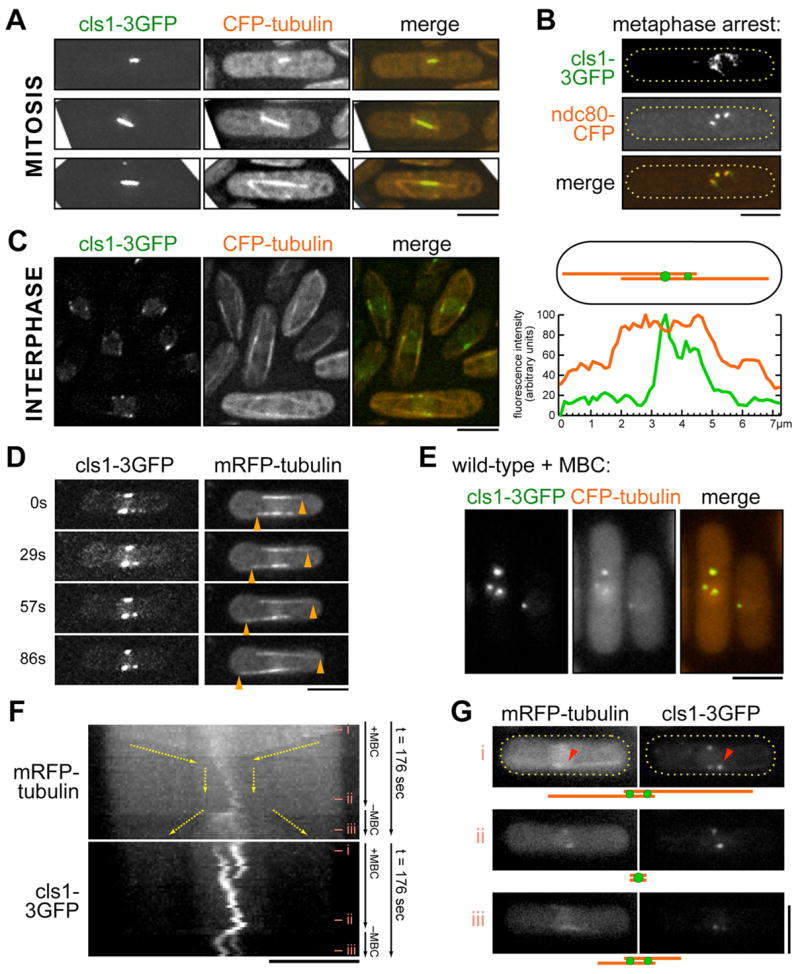
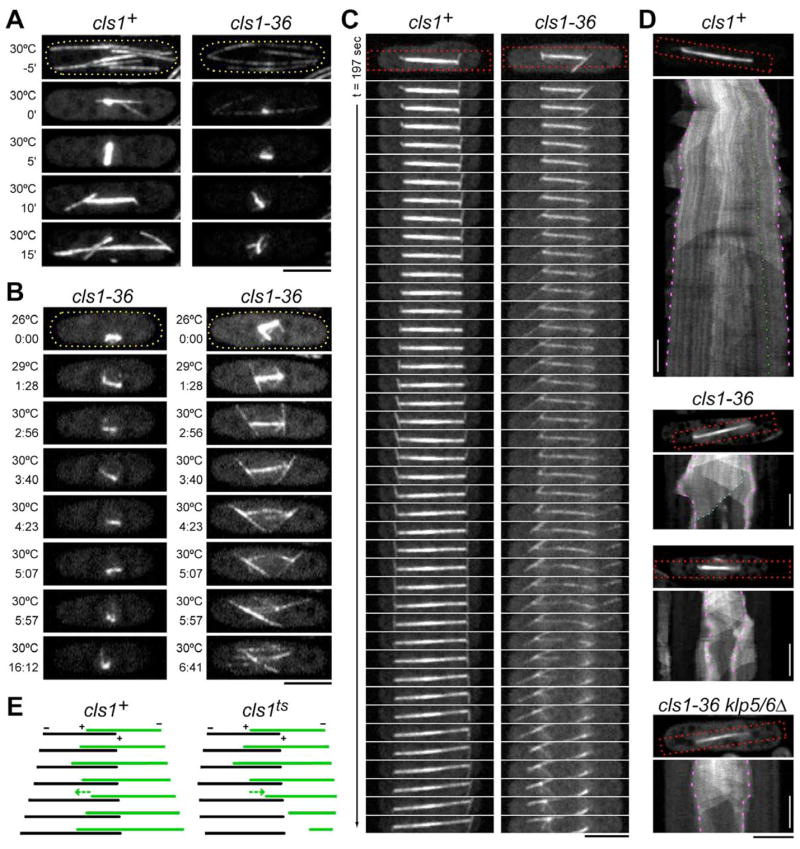
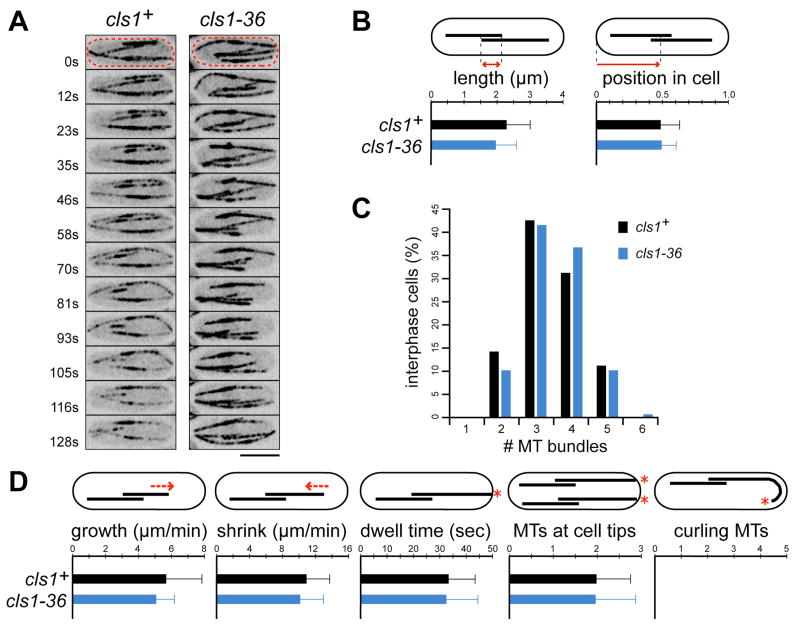
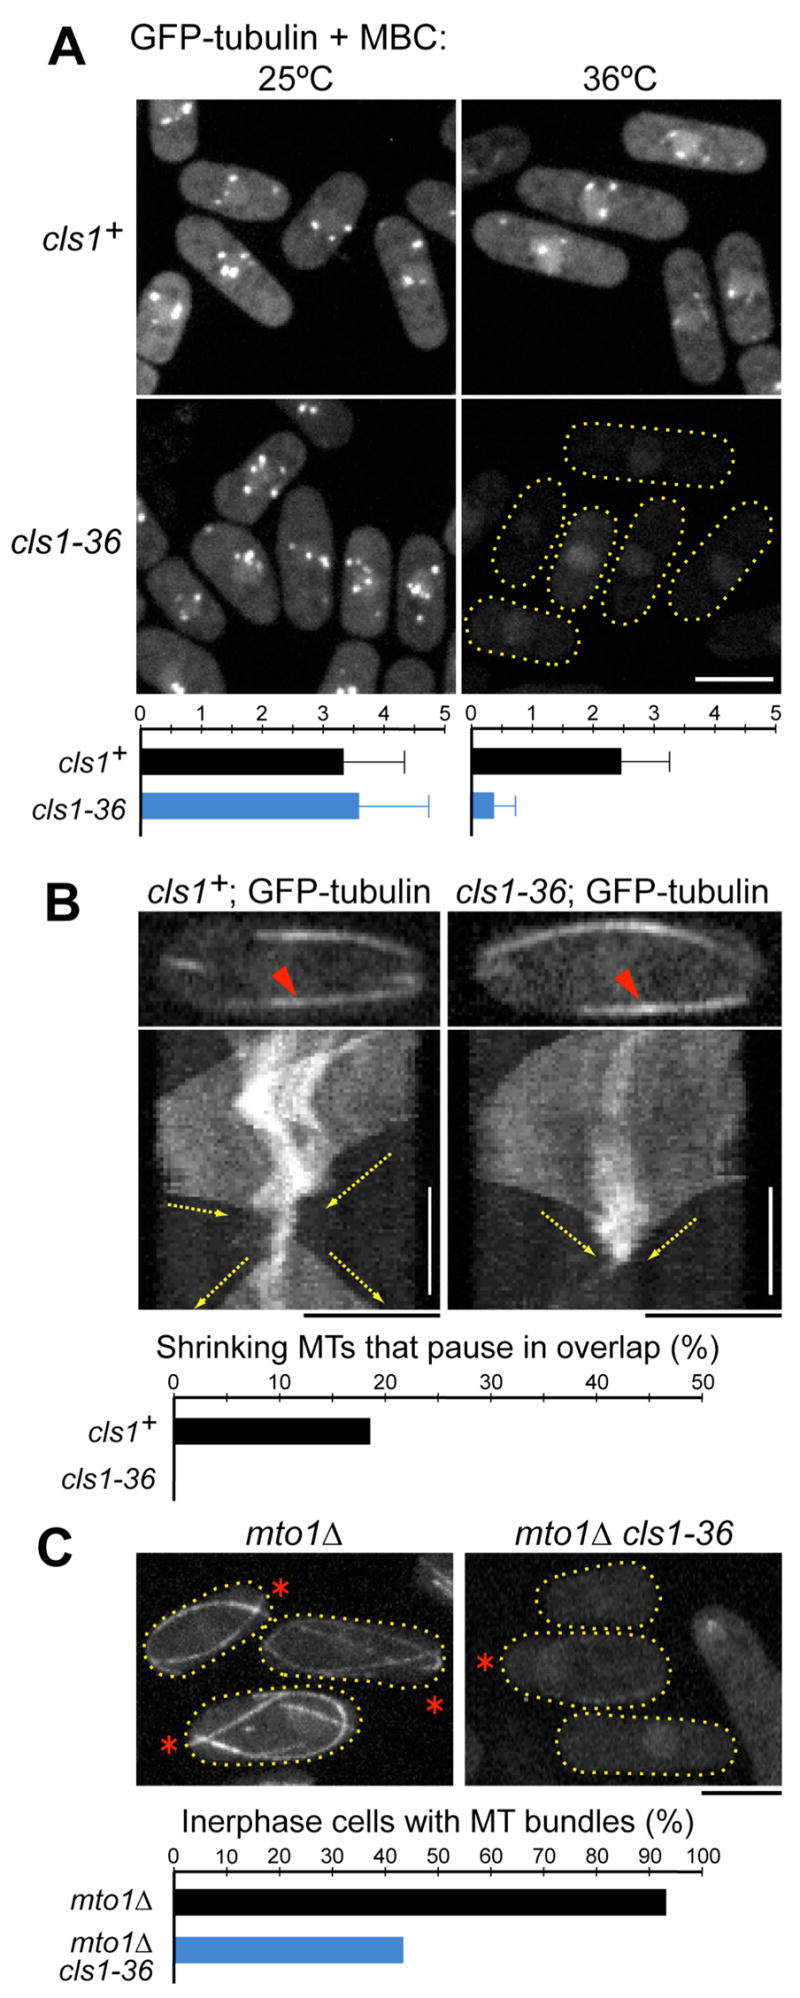
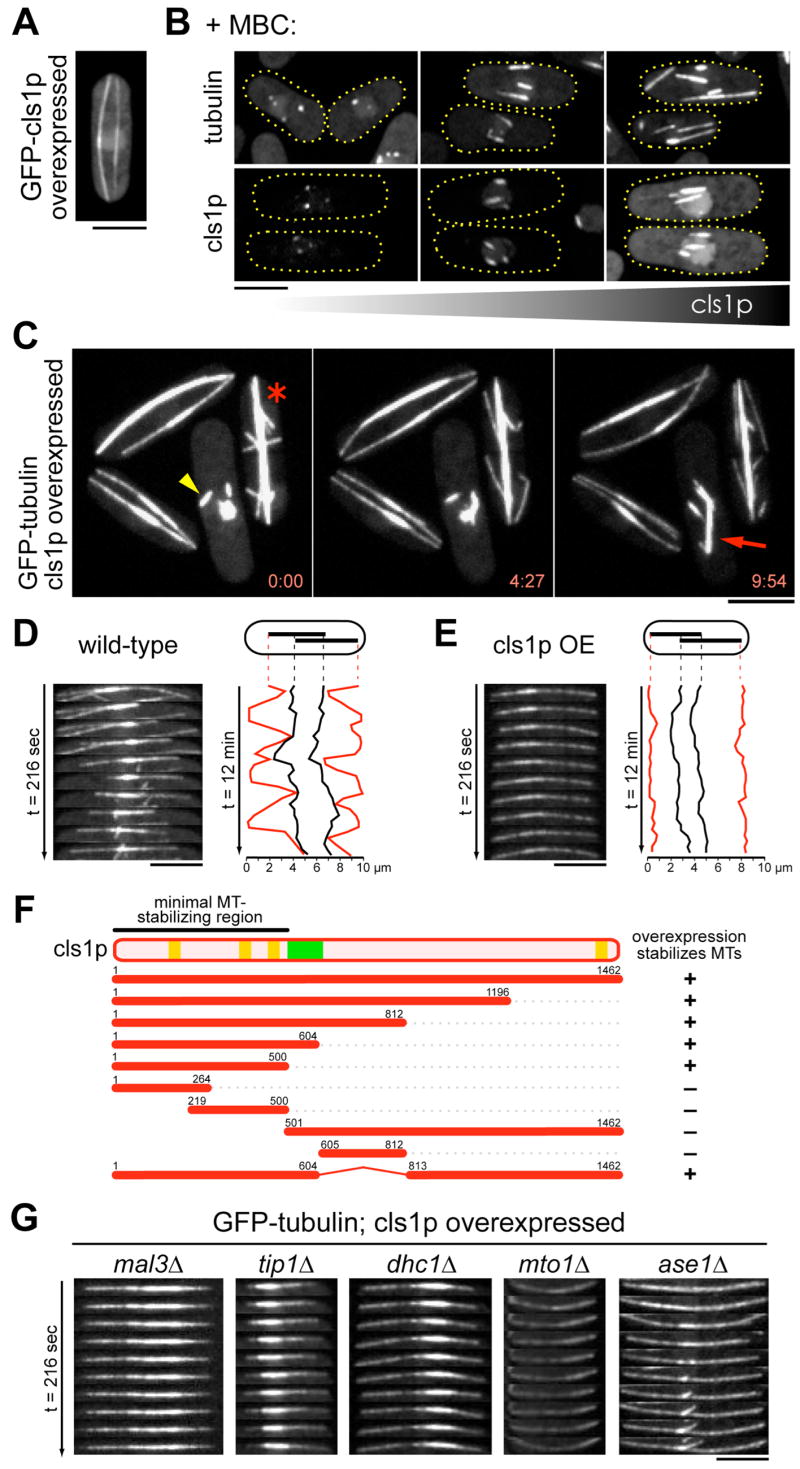
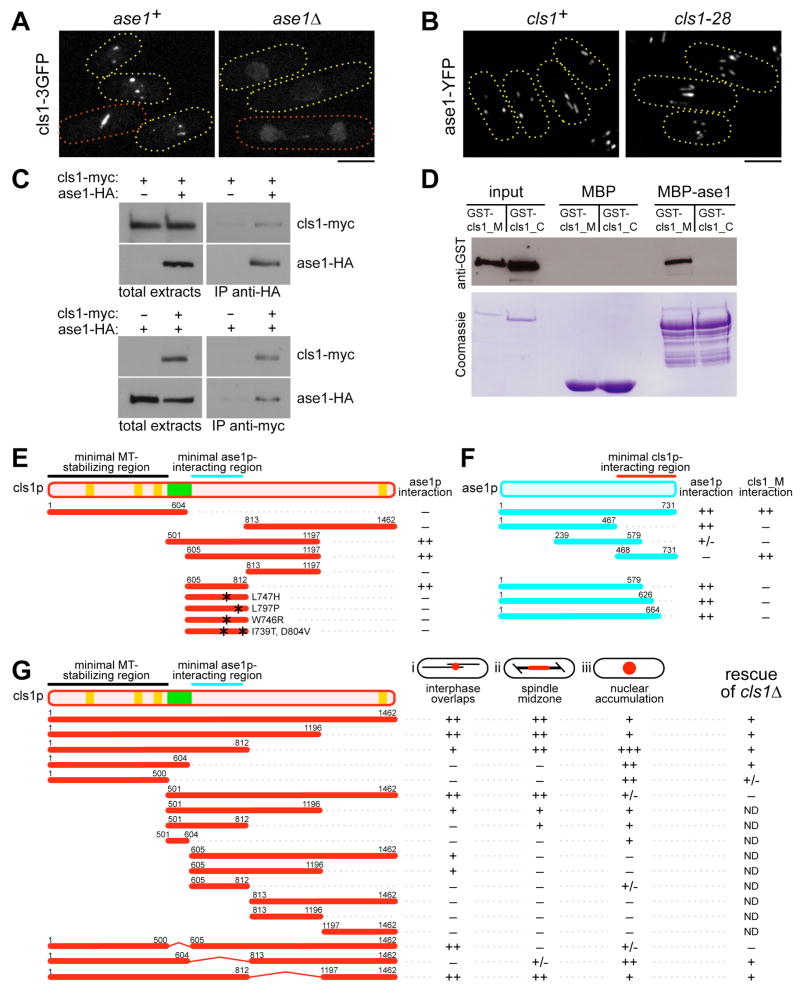
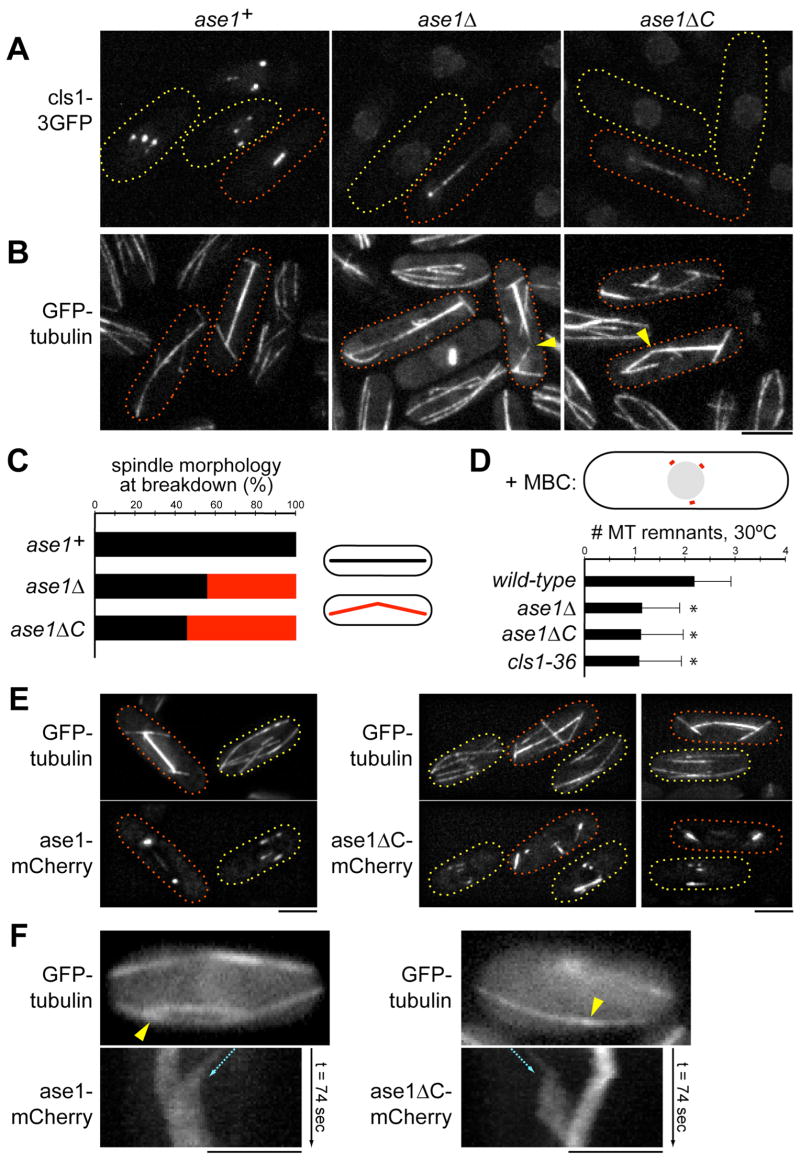
Many microtubule (MT) structures contain dynamic MTs that are bundled and stabilized in overlapping arrays. CLASPs are conserved MT-binding proteins implicated in the regulation of MT plus ends. Here, we show that the Schizosaccharomyces pombe CLASP, cls1p/peg1p, mediates the stabilization of overlapping MTs within the mitotic spindle and interphase bundles. cls1p localizes to these regions but not to interphase MT plus ends. Inactivation of cls1p leads to the rapid depolymerization of spindle midzone MTs. cls1p also stabilizes a subset of MTs within interphase bundles. cls1p prevents disassembly of the entire microtubule, while still allowing for plus-end growth. It has no measurable effects on MT nucleation, polymerization, catastrophe, or bundling. A direct interaction with ase1p (PRC1/MAP65) targets cls1p to regions of antiparallel MT overlap. These findings show how a MT-stabilizing factor attached to specific sites on MTs can help to generate MT structures that have both dynamic and stable components.


Figures

Figure 1
Figure 1. Cls1p localizes to overlapping MTs and kinetochores
(A) Mitotic cells expressing cls1-3GFP and CFP-tubulin in early mitosis (top), metaphase (middle), and anaphase (bottom). Images in (A-D) are maximum projections of deconvolved stacks. Scale bar: 5μm. (B) Cells expressing cls1-3GFP and the kinetochore marker ndc80-CFP in a tubulin mutant nda3-311, which arrests in metaphase without a spindle. (C) Interphase cells expressing cls1-3GFP and CFP-tubulin. The graph shows fluorescence intensity profile of cls1-3GFP and CFP-tubulin along one representative bundle. Note localization of cls1p to dot or dots within MT overlaps, as shown by medial regions of increased tubulin fluorescence. (D) Time-lapse images of interphase cell expressing cls1-3GFP and mRFP-tubulin. Arrowheads mark growing MT plus ends. (E) Interphase cells expressing cls1-3GFP and CFP-tubulin were treated with MBC for 10 min. Maximum projection images are shown. (F,G) Time-lapse of cell expressing cls1-3GFP and mRFP-tubulin and treated with MBC in a flow chamber. Kymographs of the indicated bundle (arrowheads)—constructed from single-plane time-lapse images (0.25 fps)—show MT plus ends (yellow arrows) shrink toward cls1p dots within the overlap zone. A region within the overlap zone is stable and can support MT regrowth once MBC is removed. For selected time points, raw images and schematic interpretations are shown (G).
Figure 2
Figure 2. Cls1p is required for assembly and maintenance of a bipolar spindle
(A) Wild-type and cls1-36 cells expressing GFP-tubulin shifted to the restrictive temperature (30ºC) during interphase. Time-lapse images monitor cells as they go from interphase (top panel) into mitosis (subsequent panels). Time listed in minutes is relative to mitotic entry. Maximum projection confocal images are shown. Scale bar: 5μm. (B) Defects in maintenance of mitotic spindle in cls1ts. cls1-36 cells were shifted to 30ºC in early mitosis (left panels) or late mitosis (right panels). Temperature and time (min:sec) are listed. (C) Anaphase spindle disassembly in cls1ts. Wild-type and cls1-36 cells were shifted to 30ºC and imaged immediately. (D) Kymographs of anaphase spindles. Cells were shifted to 30ºC and imaged by single-plane confocal time-lapse microscopy (0.5 fps). Kymographs were constructed from the red-boxed region. In wild-type GFP-tubulin speckles (one example indicated in green) track parallel to the spindle poles (purple). MT plus ends are dynamic within the midzone but rarely disassemble completely. In cls1-36 cells and cls1-36 klp5 klp6 cells, all interpolar MTs (one plus end indicated in blue) rapidly shrink to spindle poles. Vertical scale bar: 1 min. (E) Schematic representation of interpolar MT behavior in anaphase spindle kymographs from cls1+ and cls1ts cells. For clarity, dynamics are highlighted in a single MT (green) within a simple antiparallel bundle. In cls1+, the MT plus end is dynamic, but depolymerization halts in the medial overlap zone (midzone) and the MT regrows (arrow); spindle poles (minus ends) continuously separate due to pushing forces in the midzone. In cls1ts, a shrinking interpolar MT will not stop depolymerizing (arrow); without a midzone, spindle pole separation ceases.
Figure 3
Figure 3. Interphase MT bundles are properly organized in cls1ts
(A) Wild-type and cls1-36 cells expressing GFP-tubulin were imaged at 30ºC. Inverted maximum projection confocal images are shown. Scale bar: 5μm. (B) Length of interphase MT overlap zones and their relative positions in the cell (n=50 for each strain), as determined by regions of increased GFP-tubulin fluorescence intensity in bundles. (C) Number of MT bundles in interphase cls1+ and cls1-36 cells (n=100 cells for each strain). (D) Quantification of interphase MT plus end behavior. Plus end growth/shrinkage rates and dwell times at cell tips (n=24 for cls1+; n=23 for cls1-36), and the number of MTs contacting cell tips at one time (n>70 cell tips for each strain) were quantified from time-lapse images of cells at 30ºC. MTs did not curl around cell tips in 36 wild-type and 41 cls1-36 cells imaged for >6 min.
Figure 4
Figure 4. Cls1p is required for interphase MT stability at overlap zones
(A) Wild-type and cls1-36 cells expressing GFP-tubulin were grown at 25ºC, and then treated with MBC for 5 min at 25ºC. Cells were then shifted to 36ºC for 5 min or left at 25ºC. Maximum projection confocal images are shown. Scale bar: 5μm. Below: the number of stable MT remnants per cell (n>50 cells for each strain). (B) MT regrowth from a short overlap zone. Cells expressing GFP-tubulin were imaged at 30ºC. Kymographs of the indicated bundle (red arrowheads) were constructed from single-plane confocal time-lapse images (0.5 fps). In wild-type, MT plus ends (yellow arrows) shrink from both sides to a short stable stub, and after a short pause MTs grow back toward cell tips. In cls1-36, the bundle disassembles completely. Vertical scale bar: 1 min. Below: the fraction of MTs that pause within an overlap zone during depolymerization (n>60 MTs for each strain). (C) Synthetic effect of cls1 and mto1 mutations on maintenance of interphase MT bundles. Cells expressing GFP-tubulin were shifted to 30ºC for 5 min. Below: the fraction of cells (n>60 for each strain) that contain cytoplasmic MTs in interphase cells (asterisks).
Figure 5
Figure 5. Overexpressed cls1p stabilizes MTs by promoting rescue
(A) Localization of GFP-cls1p overexpressed from a full strength nmt1 promoter induced by the removal of thiamine. (B) Cls1p overexpression stabilizes MTs to MBC. Cells expressed GFP-tubulin (top panels), cls1-3GFP (bottom left), or GFP-cls1p (bottom middle, bottom right). Different levels of expression of untagged (top panels) or GFP-tagged cls1p (bottom panels) were driven by the endogenous cls1 promoter (left panels), or an integrated medium-strength (middle panels) or full-strength nmt1 promoter (right panels) in the presence of thiamine. (C,E,G) Cells expressing GFP-tubulin were induced for cls1p overexpression from an integrated full-strength nmt1 promoter by the removal of thiamine. (C) Images of MT structures in cells overexpressing cls1p. A remnant of an interphase MT bundle persists in mitosis (yellow arrowhead). A spindle elongates (red arrow), while another fails to disassemble during septation (red asterisk). Time is in min:sec. (D,E) Single interphase MT bundles from a wild-type cell (D) or a cls1p-overexpressing cell (E). Traces represent positions of plus ends (red) and boundaries of the overlap zone (black). (F) An N-terminal region of cls1p is necessary and sufficient for MT stabilization. Cells were induced to express the indicated cls1 fragments from a full-strength nmt1 promoter by removal of thiamine. HEAT repeats (orange boxes) and a basic serine-rich stretch (green box) are indicated in the cls1p schematic. Cells were scored for interphase MT stability by time-lapse imaging of GFP-tubulin. (G) Single interphase MT bundles in the indicated mutant backgrounds overexpressing cls1p. All images are maximum projections of confocal stacks. Scale bars: 5μm.
Figure 6
Figure 6. Ase1p recruits cls1p to overlapping MTs by direct binding
(A) Cls1-3GFP in wild-type and ase1Δcells. Cls1p localization is defective in ase1Δ. Cells in interphase (yellow) and anaphase (red) are shown. Maximum projection confocal images are shown. Scale bar: 5μm. (B) Ase1-YFP localization in wild-type and cls1-28 interphase cells at 33ºC. (C) Coimmunoprecipation. Extracts from yeast cells expressing ase1-HA3 and/or cls1-myc13 at endogenous levels were immunoprecipitated and probed by immunoblotting with anti-HA or anti-myc antibodies. (D) In vitro binding. GST-cls1_M (aa 501-1197) and GST-cls1_C (aa 813-1462) were expressed in bacteria, purified, and tested for binding to columns containing MBP-ase1 (full-length) or MBP. GST-tagged proteins were detected by immunoblotting. Coommassie staining shows loading control. (E) Two-hybrid assays between GAD-cls1 fragments and GBD-ase1 (full-length). The minimal ase1p-interacting region (aa 605-812) is indicated in blue. This interaction was disrupted by point mutations identified in cls1ts alleles (asterisks). (F) Two-hybrid assays between GBD-ase1 fragments and GAD-ase1 (full-length) or GAD-cls1_M. The minimal cls1p-interacting region (aa 468-731) is indicated in red. “++” denotes growth on −HIS and on −ADE, and “+/−” denotes growth only on −HIS. (G) Localization and function of exogenously expressed cls1 fragments fused to mCherry. For localization, fragments were expressed in haploid cls1+ cells co-expressing GFP-tubulin and semi-quantitatively scored for localization to the indicated cellular locales. For (i) and (ii), “++” indicates wild-type levels, and for (iii), “+” indicates wild-type levels. For functional assays, fragments were expressed in diploid cls1+/cls1Δcells, and their ability to rescue viability in haploid cls1Δspores was determined. “+” indicates full rescue. “ND”, not determined.
Figure 7
Figure 7. Ase1p C-terminus is necessary for cls1p targeting but not MT bundling
(A) Defective localization of cls1-3GFP in ase1Δand ase1ΔC (truncation of aa 665-731). Maximum projection confocal images of cells in interphase (yellow) and anaphase (red) are shown. Scale bar: 5μm. (B) Anaphase spindle elongation defects in ase1Δand ase1ΔC. Maximum projection confocal images of cells expressing GFP-tubulin show similarly broken (arrowheads) and asymmetric spindles in ase1 mutants. (C) Quantification of anaphase spindles that displayed broken morphology, as seen in (B). For each strain, >20 spindles were examined in time-lapse. (D) Quantification of the number of stable MT remnants in MBC-treated cells at 30°C (n>120 cells for each strain). ase1 mutants are defective in stabilization of interphase MT bundle overlap zones (“*” P<10−4). (E) Localization of ase1-mCherry and ase1ΔC-mCherry to MT overlap zones. Interphase (yellow) and anaphase cells (red) are shown. Images are maximum projections of deconvolved stacks. (F) Ase1-mCherry and ase1 C-mCherry localization on single interphase MT bundles. Top, single-plane image of GFP-tubulin. Bottom, kymographs of the mCherry fusion proteins along the indicated bundle (yellow arrowheads)—constructed from single-plane time-lapse images (0.5 fps)—showing association with a newly-nucleated MT sliding toward the main overlap zone of the bundle (blue arrow).

References

    1. Akhmanova A, Hoogenraad CC. Microtubule plus-end-tracking proteins: mechanisms and functions. Curr Opin Cell Biol. 2005;17:47–54. - PubMed
    1. Akhmanova A, Hoogenraad CC, Drabek K, Stepanova T, Dortland B, Verkerk T, Vermeulen W, Burgering BM, De Zeeuw CI, Grosveld F, Galjart N. Clasps are CLIP-115 and -170 associating proteins involved in the regional regulation of microtubule dynamics in motile fibroblasts. Cell. 2001;104:923–935. - PubMed
    1. Al-Bassam J, Larsen NA, Hyman AA, Harrison SC. Crystal structure of a TOG domain: conserved features of XMAP215/Dis1-family TOG domains and implications for tubulin binding. Structure. 2007;15:355–362. - PubMed
    1. Baas PW, Black MM. Individual microtubules in the axon consist of domains that differ in both composition and stability. J Cell Biol. 1990;111:495–509. - PMC - PubMed
    1. Baas PW, Deitch JS, Black MM, Banker GA. Polarity orientation of microtubules in hippocampal neurons: uniformity in the axon and nonuniformity in the dendrite. Proc Natl Acad Sci U S A. 1988;85:8335–8339. - PMC - PubMed

Publication types

MeSH terms

Substances