. 2007 Nov-Dec;128(11-12):717-30.
doi: 10.1016/j.mad.2007.10.011. Epub 2007 Nov 1.

Aging-associated truncated form of p53 interacts with wild-type p53 and alters p53 stability, localization, and activity

Affiliations

Aging-associated truncated form of p53 interacts with wild-type p53 and alters p53 stability, localization, and activity

Lynette Moore et al. Mech Ageing Dev. 2007 Nov-Dec.

Abstract

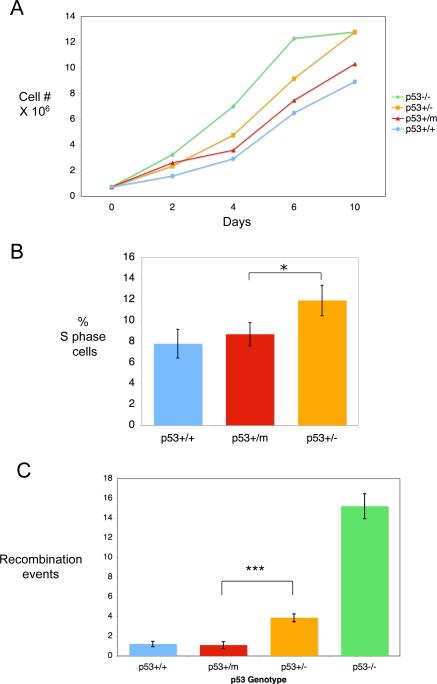
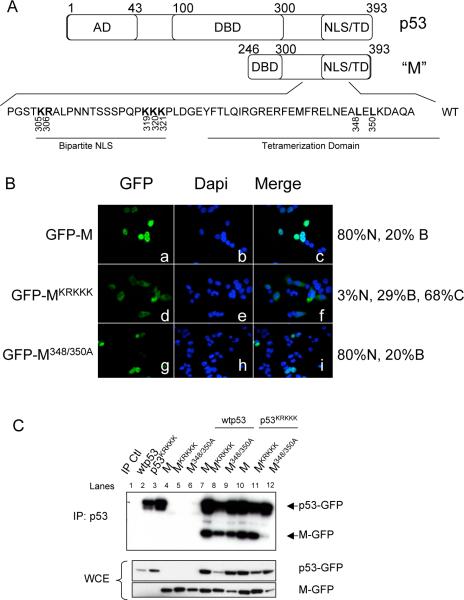
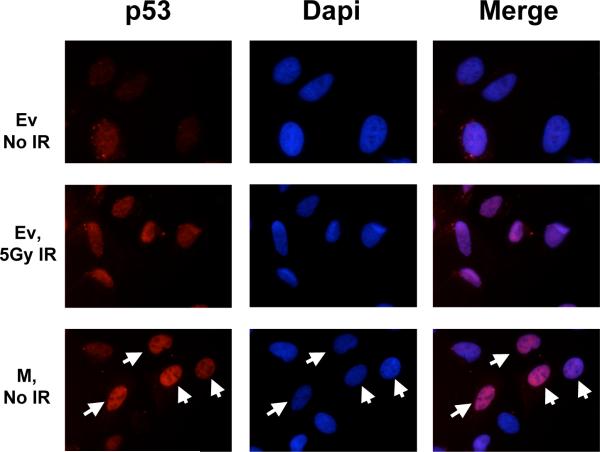
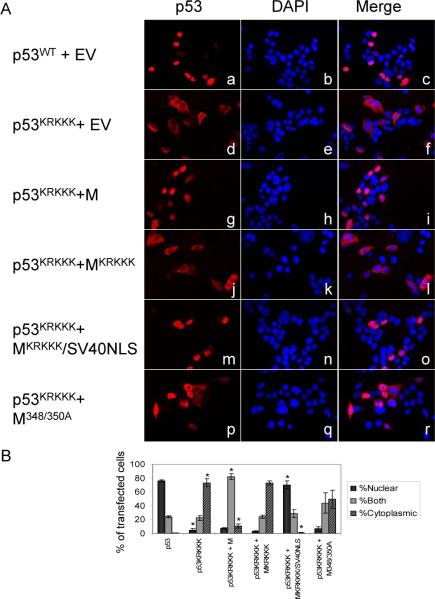
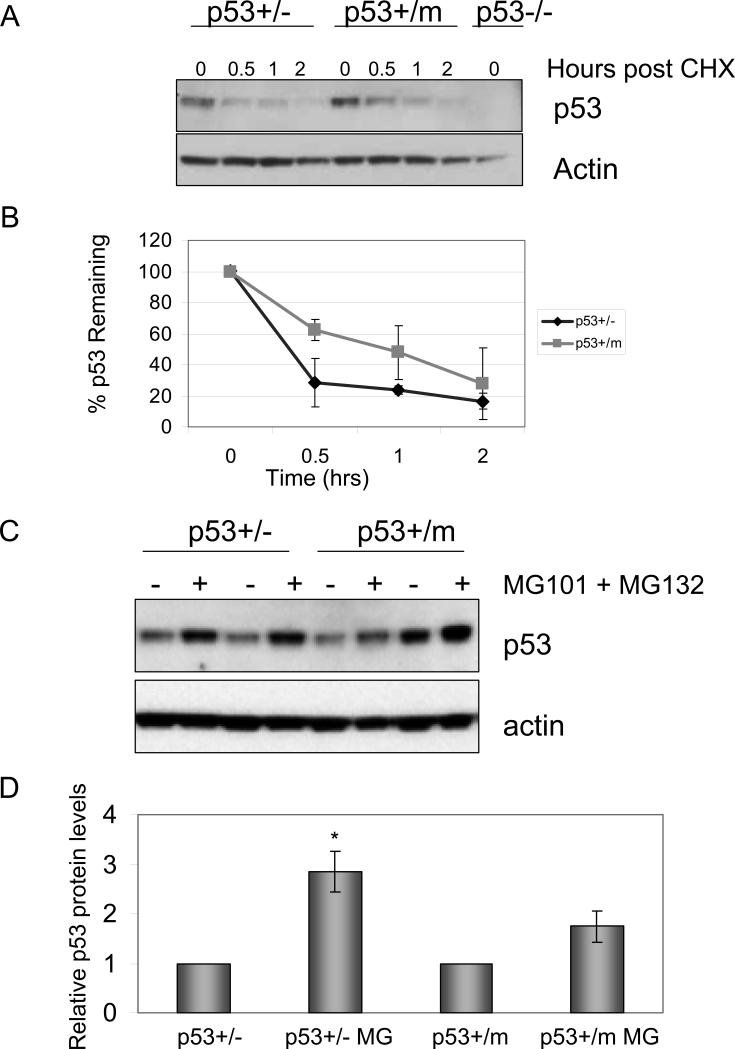
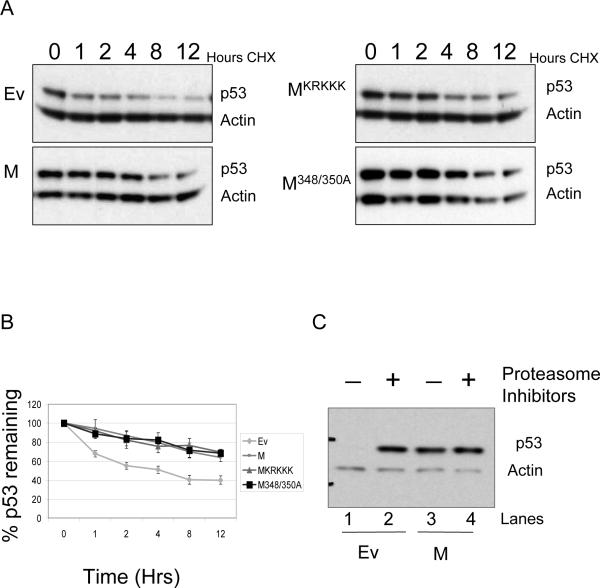
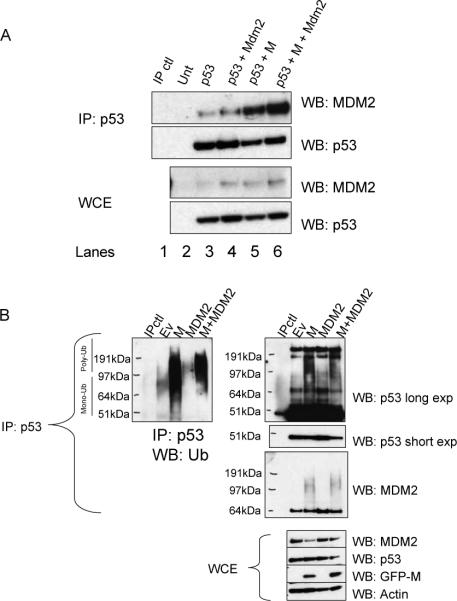
Evidence has accumulated that p53, a prototypical tumor suppressor, may also influence aspects of organismal aging. We have previously described a p53 mutant mouse model, the p53+/m mouse, which is cancer resistant yet exhibits reduced longevity and premature aging phenotypes. p53+/m mice express one full length p53 allele and one truncated p53 allele that is translated into a C-terminal fragment of p53 termed the M protein. The augmented cancer resistance and premature aging phenotypes in the p53+/m mice are consistent with a hyperactive p53 state. To determine how the M protein could increase p53 activity, we examined the M protein in various cellular contexts. Here, we show that embryo fibroblasts from p53+/m mice exhibit reduced proliferation and cell cycle progression compared to embryo fibroblasts from p53+/- mice (with equivalent wild-type p53 dosage). The M protein interacts with wild-type p53, increases its stability, and facilitates its nuclear localization in the absence of stress. Despite increasing p53 stability, the M protein does not disrupt p53-Mdm2 interactions and does not prevent p53 ubiquitination. These results suggest molecular mechanisms by which the M protein could influence the aging and cancer resistance phenotypes in the p53+/m mouse.


Figures

Figure 1
Figure 1
Growth kinetics, cell cycle checkpoint control, and suppression of recombination of p53+/+, p53+/−, p53+/m, and p53−/− MEFs. A. Representative growth kinetics of p53+/+, p53+/−, p53+/m, and p53−/− MEFs. 750,000 cells were plated onto 10cm dishes and collected and counted on the days indicated. T-tests on multiple growth experiments indicated no significant difference between p53+/+ and p53+/m growth rates (P = 0.61), while growth rate differences between p53+/m and p53+/− MEFs were significantly different (P = 0.003). B. S phase fractions in rapidly dividing MEFs of different p53 genotypes. MEFs were analyzed for DNA content and BrdU incorporation by flow cytometry and the percentage of cells in S phase was calculated. T-tests indicated the S phase fractions of p53+/m and p53+/+ MEFs were not significantly different (P = 0.47), while S phase fractions of p53+/m and p53+/− MEFs were significantly different and are indicated by an asterisk (P = 0.05). C. Suppression of recombination in p53+/+, p53+/−, p53+/m, and p53−/− passage 1−3 MEFs. p53+/+, p53+/−, p53+/m, and p53−/− MEFs were infected with a retrovirus expressing two tandem copies of mutant forms of a GFP-Zeocin gene as well as a neomycin resistance marker. MEFs were selected with G418 or G418 plus Zeocin to determine the recombination frequencies. The p53+/m MEFs have a recombination frequency roughly equal to that of p53+/+ MEFs. The difference in recombination frequency between p53+/m and p53+/− MEFs is highly significant (P < .0001) and is indicated by three asterisks. Differences between p53+/+ and p53+/− MEFs are also statistically significant (P < .0001).
Figure 2
Figure 2
Effects of wild-type p53, mutant p53, and the p53 m allele on growth suppression of human osteosarcoma cells. A-C. Colony formation in osteosarcoma cells. Saos-2 cells (null for p53) (A), U2OS cells (wild-type for p53) (B), and TE85 (containing mutant p53) (C), were transfected with empty vector (zeocin resistance) constructs, wild-type p53 (zeocin resistance) expression constructs, and m allele expression (zeocin resistance) constructs. Forty-eight hours after transfection, osteosarcoma cells were selected in zeocin for two weeks and zeocin resistant colonies fixed, stained and counted. D. Saos-2 cells were transfected with a zeocin resistance gene construct expressing either no insert (empty vector), a mutant version of p53 (codon 172 arg→his), wild-type p53, or the truncated p53 m allele, or the indicated combination of vectors. Zeocin resistant colonies were identified and counted as described for panels A-C.
Figure 3
Figure 3
The M protein localizes to the nucleus and interacts with wild-type p53. A. Diagram of human p53 and the M protein. Residues that were mutated to alanine in the NLS and tetramerization domain are shown in bold. AD: Activation Domain. DBD: DNA Binding Domain. NLS/TD: Nuclear Localization Signal/Tetramerization Domain. B. Localization of M and M mutants. Cells were transfected with GFP tagged M (panels a-c), GFP tagged MKRKKK (panels d-f), or GFP tagged M348/350A (panels g-i) as indicated. The localization of M was determined by immunofluorescence and nuclei visualized by DAPI staining. 300 cells were counted and scored as having GFP-M mostly nuclear (N), mostly cytoplasmic (C), or both nuclear and cytoplasmic (B). Percentages listed are an average of three independent experiments. C. Interaction between p53 and M mutants. p53−/− HCT116 cells were transfected with GFP tagged p53 and M expression constructs as indicated. p53 was immunoprecipitated with an antibody specific to the N-terminus of p53. Membranes were probed with an antibody to GFP to detect both full-length p53 and the M protein.
Figure 4
Figure 4
The M protein induces nuclear accumulation of p53. U2OS cells were transfected with empty vector (Ev) or a plasmid encoding M. Cells were irradiated with 5 Grays of ionizing radiation or mock irradiated four hours prior to fixing and immunostaining for full-length p53. Top: Empty vector transfected cells. Middle: Empty vector transfected cells 4 hours following irradiation. Bottom: M transfected cells. Cells that are transfected with M (indicated by white arrows) have increased nuclear p53 compared to untransfected cells.
Figure 5
Figure 5
M induces nuclear localization of a p53 NLS mutant (p53KRKKK) and this is dependent on the nuclear localization signal of M and efficient interaction between p53 and the M protein. A. p53−/− HCT116 cells were transfected with the plasmids indicated. Localization of full-length p53 was determined by immunofluorescence. B. Quantification of immunofluorescence staining in A. 300 cells per transfection condition were scored as having primarily nuclear p53, primarily cytoplasmic p53, or both nuclear and cytoplasmic p53. Values are the average of three independent experiments and error bars represent standard error. * p<.001; p53KRKKK is compared to p53wt and all others are compared to p53KRKKK.
Figure 6
Figure 6
p53 protein levels are more stable in p53+/m MEFs compared to p53+/− MEFs. A. p53 protein levels in the absence of de novo protein synthesis. Low passage MEFs were treated with cycloheximide and cell lysates collected at the indicated time points. B. p53+/m MEFs exhibit increased p53 stability compared to p53+/− MEFs. Western blots were normalized to actin, quantitated by densitometry and graphed as the percent p53 remaining over time relative to the zero time point. The graph represents the average of three independent experiments (and independent MEF lines). Error bars represent standard error of the mean. Statistical analyses (ANOVA) indicated that cycloheximide treated p53+/m cells exhibited significant increases in p53 stability compared to similarly treated p53+/− cells (P = 0.04). C. p53 protein levels in p53+/m and p53+/− MEFs after treatment with proteasome inhibitors. Two different isolates of of low passage p53+/− MEFs (MEF-1: lanes 1,2; MEF-2: lanes 3,4) and p53+/m MEFs (MEF-3: lanes 5,6; MEF-4: lanes 7,8) were untreated or treated with proteasome inhibitors MG101 and MG132 for 6 hours prior to harvest. p53 protein levels accumulate upon proteasome inhibitor treatment in p53+/− MEFs, but are not significantly increased in p53+/m MEFs implying that p53 is protected from proteasomal degradation in p53+/m MEFs. D. p53 protein levels are less sensitive to proteasome inhibitors in p53+/m MEFs. Western blots in C were normalized to actin and quantitated by densitometry. The values shown are the average p53 levels of three independent MEF lines for each genotype and error bars represent standard error. *P < 0.01 compared to p53+/− untreated control. CHX: cycloheximide.
Figure 7
Figure 7
The M protein enhances the stability of full-length p53. U2OS cells were transfected with plasmids encoding M and M mutants as indicated. A. p53 protein levels in the absence of de novo protein synthesis. Cells were treated with cycloheximide and protein lysates collected at the indicated time points followed by a Western blot for total p53. B. Graphical representation of total p53 levels in A after normalization to actin levels. Blots were scanned on a GE Storm 860 imager and quantitated using ImageQuant software. The graphs indicate the percent p53 remaining relative to the zero time point. Values represent the average of three independent experiments and error bars represent standard error. Statistical analyses (ANOVA) indicated that empty vector transfected U2OS cells exhibited significantly less p53 stability than cells transfected with M or mutant M vectors (P < .0001). C. p53 protein levels after treatment with proteasome inhibitors. Following transfection with empty vector or M, U2OS cells were treated with the proteasome inhibitors MG101 and MG132 for 6 hours. Cells were harvested and p53 protein levels analyzed by Western blot. p53 accumulates in the presence of the proteasome inhibitors in cells transfected with empty vector. However, p53 protein levels are not affected in cells transfected with M, indicating that the M protein protects p53 from proteasomal degradation.
Figure 8
Figure 8
The M protein does not enhance p53 stability by disrupting MDM2 function. p53 null Saos-2 cells were transfected with combinations of p53, M, and MDM2 as indicated. A. The M protein increases MDM2-p53 interactions. Lysates from transfected Saos-2 cells were immunoprecipitated with a p53 antibody, and Western blots were probed with antibodies to p53 and MDM2. MDM2 is readily detected in complex with p53 in the presence of M. The Western blot of total lysate prior to immunoprecipitation is also shown. B. Ubiquitination of p53. U2OS cells were transfected with the indicated combinations of M and MDM2. Total p53 was immunoprecipitated and Western blots were probed with antibodies to Ubiquitin, p53, and MDM2. IP: Immunoprecipitate, WB: Western blot, WCE: whole cell extract, Ub: ubiquitin.

Similar articles

Cited by

References

    1. Alarcon-Vargas D, Ronai Z. p53-Mdm2--the affair that never ends. Carcinogenesis. 2002;23(4):541–547. - PubMed
    1. Baker DJ, Jeganathan KB, Malureanu L, Perez-Terzic C, Terzic A, van Deursen JMA. Early aging-associated phenotypes in Bub3/Rae1 haploinsufficient mice. J.Cell Biol. 2006;172(4):529–540. - PMC - PubMed
    1. Bertrand P, Rouillard D, Boulet A, Levalois C, Soussi T, Lopez BS. Increase of spontaneous intrachromosomal homologous recombination in mammalian cells expressing a mutant p53 protein. Oncogene. 1997;14(9):1117–1122. - PubMed
    1. Bourdon JC, Fernandes K, Murray-Zmijewski F, Liu G, Diot A, Xirodimas DP, Saville MK, Lane DP. p53 isoforms can regulate p53 transcriptional activity. Genes Dev. 2005;19(18):2122–2137. - PMC - PubMed
    1. Bunz F, Dutriaux A, Lengauer C, Waldman T, Zhou S, Brown JP, Sedivy JM, Kinzler KW, Vogelstein B. Requirement for p53 and p21 to sustain G2 arrest after DNA damage. Science. 1998;282(5393):1497–1501. - PubMed

Publication types

MeSH terms