

Gene expression analysis reveals early changes in several molecular pathways in cerebral malaria-susceptible mice versus cerebral malaria-resistant mice
- PMID: 18062806
- PMCID: PMC2246131
- DOI: 10.1186/1471-2164-8-452
Gene expression analysis reveals early changes in several molecular pathways in cerebral malaria-susceptible mice versus cerebral malaria-resistant mice
Abstract
Background: Microarray analyses allow the identification and assessment of molecular signatures in whole tissues undergoing pathological processes. To better understand cerebral malaria pathogenesis, we investigated intra-cerebral gene-expression profiles in well-defined genetically cerebral malaria-resistant (CM-R) and CM-susceptible (CM-S) mice, upon infection by Plasmodium berghei ANKA (PbA). We investigated mouse transcriptional responses at early and late stages of infection by use of cDNA microarrays.
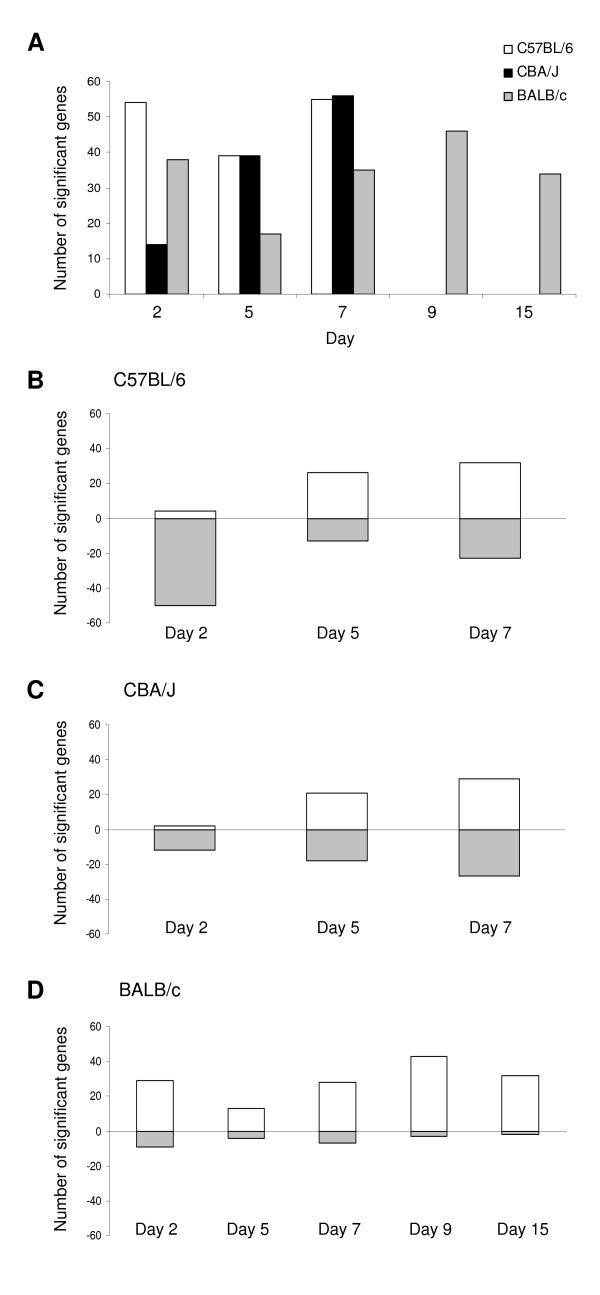
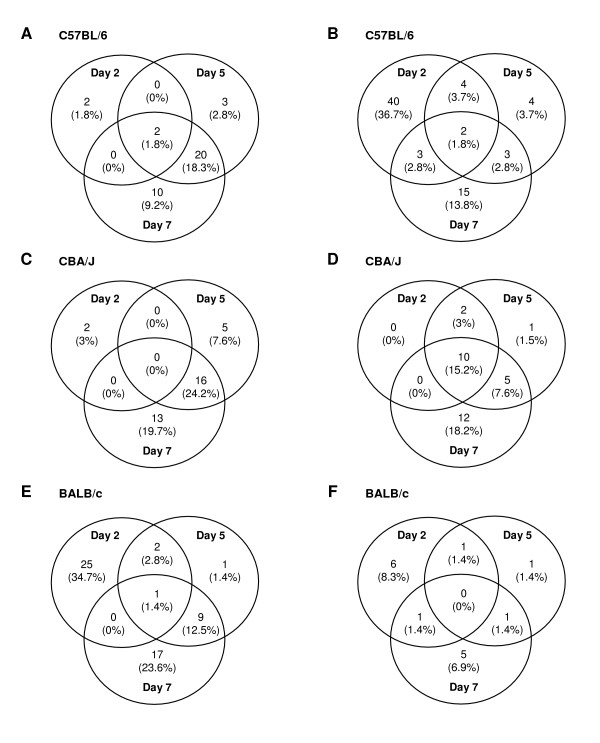
Results: Through a rigorous statistical approach with multiple testing corrections, we showed that PbA significantly altered brain gene expression in CM-R (BALB/c), and in CM-S (CBA/J and C57BL/6) mice, and that 327 genes discriminated between early and late infection stages, between mouse strains, and between CM-R and CM-S mice. We further identified 104, 56, 84 genes with significant differential expression between CM-R and CM-S mice on days 2, 5, and 7 respectively. The analysis of their functional annotation indicates that genes involved in metabolic energy pathways, the inflammatory response, and the neuroprotection/neurotoxicity balance play a major role in cerebral malaria pathogenesis. In addition, our data suggest that cerebral malaria and Alzheimer's disease may share some common mechanisms of pathogenesis, as illustrated by the accumulation of beta-amyloid proteins in brains of CM-S mice, but not of CM-R mice.
Conclusion: Our microarray analysis highlighted marked changes in several molecular pathways in CM-S compared to CM-R mice, particularly at early stages of infection. This study revealed some promising areas for exploration that may both provide new insight into the knowledge of CM pathogenesis and the development of novel therapeutic strategies.
Figures


Similar articles
-
Simultaneous host and parasite expression profiling identifies tissue-specific transcriptional programs associated with susceptibility or resistance to experimental cerebral malaria.BMC Genomics. 2006 Nov 22;7:295. doi: 10.1186/1471-2164-7-295. BMC Genomics. 2006. PMID: 17118208 Free PMC article.
-
Gene-expression profiling discriminates between cerebral malaria (CM)-susceptible mice and CM-resistant mice.J Infect Dis. 2006 Jan 15;193(2):312-21. doi: 10.1086/498579. Epub 2005 Dec 5. J Infect Dis. 2006. PMID: 16362897
-
Differential microRNA expression in experimental cerebral and noncerebral malaria.Infect Immun. 2011 Jun;79(6):2379-84. doi: 10.1128/IAI.01136-10. Epub 2011 Mar 21. Infect Immun. 2011. PMID: 21422175 Free PMC article.
-
Expression microarray analysis implicates apoptosis and interferon-responsive mechanisms in susceptibility to experimental cerebral malaria.Am J Pathol. 2007 Dec;171(6):1894-903. doi: 10.2353/ajpath.2007.070630. Epub 2007 Nov 8. Am J Pathol. 2007. PMID: 17991715 Free PMC article.
-
Genetic analysis of cerebral malaria in the mouse model infected with Plasmodium berghei.Mamm Genome. 2018 Aug;29(7-8):488-506. doi: 10.1007/s00335-018-9752-9. Epub 2018 Jun 19. Mamm Genome. 2018. PMID: 29922917 Review.
Cited by
-
Impact of methylene blue and atorvastatin combination therapy on the apparition of cerebral malaria in a murine model.Malar J. 2013 Apr 15;12:127. doi: 10.1186/1475-2875-12-127. Malar J. 2013. PMID: 23587099 Free PMC article.
-
A rapid murine coma and behavior scale for quantitative assessment of murine cerebral malaria.PLoS One. 2010 Oct 1;5(10):e13124. doi: 10.1371/journal.pone.0013124. PLoS One. 2010. PMID: 20957049 Free PMC article.
-
Genetic, Transcriptome, Proteomic, and Epidemiological Evidence for Blood-Brain Barrier Disruption and Polymicrobial Brain Invasion as Determinant Factors in Alzheimer's Disease.J Alzheimers Dis Rep. 2017 Sep 28;1(1):125-157. doi: 10.3233/ADR-170017. J Alzheimers Dis Rep. 2017. PMID: 30480234 Free PMC article.
-
A genetically hard-wired metabolic transcriptome in Plasmodium falciparum fails to mount protective responses to lethal antifolates.PLoS Pathog. 2008 Nov;4(11):e1000214. doi: 10.1371/journal.ppat.1000214. Epub 2008 Nov 21. PLoS Pathog. 2008. PMID: 19023412 Free PMC article.
-
Eimeria falciformis infection of the mouse caecum identifies opposing roles of IFNγ-regulated host pathways for the parasite development.Mucosal Immunol. 2014 Jul;7(4):969-82. doi: 10.1038/mi.2013.115. Epub 2013 Dec 25. Mucosal Immunol. 2014. PMID: 24368565
References
-
- Lovegrove FE, Pena-Castillo L, Mohammad N, Liles WC, Hughes TR, Kain KC. Simultaneous host and parasite expression profiling identifies tissue-specific transcriptional programs associated with susceptibility or resistance to experimental cerebral malaria. BMC Genomics. 2006;7:295. doi: 10.1186/1471-2164-7-295. - DOI - PMC - PubMed
Publication types
MeSH terms
Substances
LinkOut - more resources
Full Text Sources
