. 2008 Feb 15;586(4):965-87.
doi: 10.1113/jphysiol.2007.145375. Epub 2007 Dec 6.

Developmental maturation of synaptic and extrasynaptic GABAA receptors in mouse thalamic ventrobasal neurones

Affiliations

Developmental maturation of synaptic and extrasynaptic GABAA receptors in mouse thalamic ventrobasal neurones

Dianne R Peden et al. J Physiol. .

Abstract

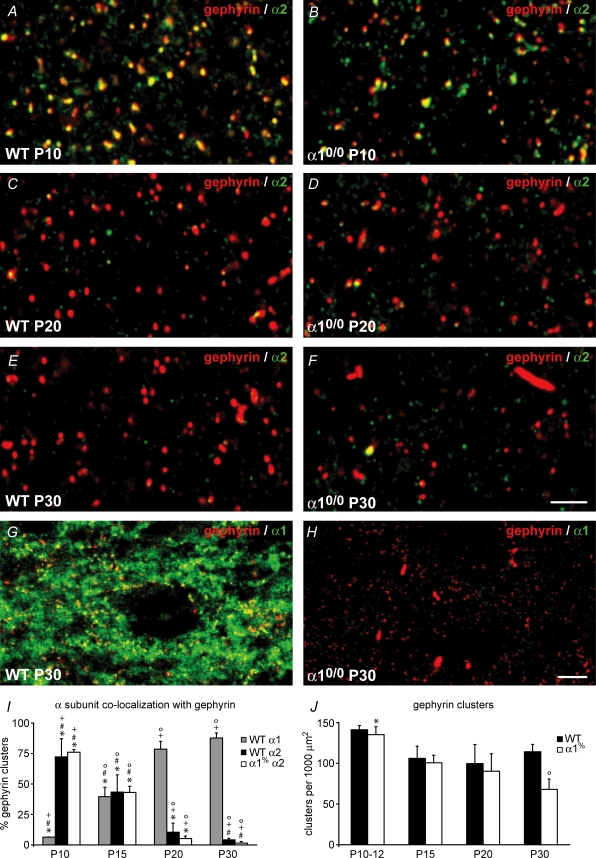
Thalamic ventrobasal (VB) relay neurones express multiple GABA(A) receptor subtypes mediating phasic and tonic inhibition. During postnatal development, marked changes in subunit expression occur, presumably reflecting changes in functional properties of neuronal networks. The aims of this study were to characterize the properties of synaptic and extrasynaptic GABA(A) receptors of developing VB neurones and investigate the role of the alpha(1) subunit during maturation of GABA-ergic transmission, using electrophysiology and immunohistochemistry in wild type (WT) and alpha(1)(0/0) mice and mice engineered to express diazepam-insensitive receptors (alpha(1H101R), alpha(2H101R)). In immature brain, rapid (P8/9-P10/11) developmental change to mIPSC kinetics and increased expression of extrasynaptic receptors (P8-27) formed by the alpha(4) and delta subunit occurred independently of the alpha(1) subunit. Subsequently (> or = P15), synaptic alpha(2) subunit/gephyrin clusters of WT VB neurones were replaced by those containing the alpha(1) subunit. Surprisingly, in alpha(1)(0/0) VB neurones the frequency of mIPSCs decreased between P12 and P27, because the alpha(2) subunit also disappeared from these cells. The loss of synaptic GABA(A) receptors led to a delayed disruption of gephyrin clusters. Despite these alterations, GABA-ergic terminals were preserved, perhaps maintaining tonic inhibition. These results demonstrate that maturation of synaptic and extrasynaptic GABA(A) receptors in VB follows a developmental programme independent of the alpha(1) subunit. Changes to synaptic GABA(A) receptor function and the increased expression of extrasynaptic GABA(A) receptors represent two distinct mechanisms for fine-tuning GABA-ergic control of thalamic relay neurone activity during development.


Figures

Figure 1
Figure 1. The properties of mIPSCs recorded from VB neurones of WT mice are developmentally regulated
A, superimposed ensemble averages of mIPSCs recorded from exemplar VB neurones of WT mice at five different developmental stages (P8–9, P10–11, P12–14, P15–22 and P23–27). The traces illustrate the changes to peak amplitude (left panel) and synaptic current decay (right panel) that occur with development. In the right-hand panel, all traces are normalized to the peak amplitude of the exemplar P23–27 recording to highlight the change to the mIPSC decay that occurs with maturation. B, combined cumulative probability plots of the peak amplitude (left panel) and of the time required for individual mIPSCs to decay from peak amplitude to 10% of peak (T90, right panel). The plots are constructed from peak amplitude and T90 values obtained from 945 to 2142 mIPSCs collected from 10 representative neurones for each of the five age groups investigated. Note the progressive leftward shift of both the peak amplitude and T90 values with development (P < 0.01; KS test), although the changes to amplitude and kinetics are not synchronous. C, bar graph illustrating the increase of VB mIPSC frequency with development. Data were obtained from 18–66 cells. Error bars indicate the s.e.m.D, recordings obtained from exemplar WT VB neurones for the P8–9 (top trace) and P23–27 (bottom trace) age groups illustrating the increase of mIPSC frequency with development (*P < 0.05, one-way ANOVA).
Figure 2
Figure 2. The selective synaptic expression of the GABAA receptor α1 subunit in P15–22 VB neurones
A, superimposed ensemble averages of VB mIPSCs recorded in the absence (black traces) and presence of the α1 subunit selective imidazopyridine, zolpidem (100 nm, grey traces) from exemplar WT (Aa) and α1H101R (Ab) neurones. Note that zolpidem prolongs the decay of WT mIPSCs, but not those recorded from α1H101R mice, consistent with the synaptic expression of the α1 subunit. B, summary bar graph illustrating the effects of zolpidem (100 nm, 1 μm) and Ro15-4513 (10 μm) upon the decay (τw, expressed as percentage change) of mIPSCs recorded from VB neurones of WT (black bars) and α1H101R (open bars) mice. Also illustrated are the effects of the α3 selective ligand, TP003 (100 nm), upon the decay of mIPSCs recorded from WT nRT (grey bar) and VB (black bar) neurones. C, superimposed representative mIPSC averages recorded from exemplar WT (black traces) and α10/0 (grey traces) nRT (Ca) and VB (Cb) neurones. Deletion of the α1 subunit causes a clear reduction in VB mIPSC frequency (not shown) and a decrease in amplitude of the remaining synaptic currents. Note that the majority (32/44 neurones, i.e. 73%) of P15–22 α10/0 neurones were silent and no mIPSCs were evident for P23–27 α10/0 neurones (16 cells tested). By contrast, deletion of the α1 subunit had no significant effect on the mIPSCs recorded from nRT neurones. Data were obtained from 3–6 cells. Asterisks in B indicate statistical differences (*P < 0.05, ***P < 0.001). Error bars indicate s.e.m.
Figure 3
Figure 3. GABAA receptor-mediated synaptic transmission is disrupted by deletion of the α1 subunit, but only later in development
Recordings obtained from exemplar WT (left-hand column) and α10/0 (right-hand column) VB neurones for five different age groups. Early in development (P8–11) mIPSCs recorded from VB neurones of α10/0 mice are indistinguishable from those of WT. However, beyond P14, the majority of VB neurones from α10/0 mice are devoid of mIPSCs. The proportion of recorded cells displaying synaptic currents is stated below each exemplar trace.
Figure 4
Figure 4. The developmental change (P8–14) to mIPSC amplitude and decay do not require the GABAAα1 subunit
A, representative superimposed averages of mIPSCs recorded from exemplar WT (black traces) and α10/0 (grey traces) VB neurones of P8–9, P10–11 and P12–14 mice. Note that, even in the absence of the α1 subunit, the mIPSC decay shortens at P10–11 and P12–14 compared with P8–9. B, a combined cumulative probability plot of the mIPSC T90 values obtained from 774–2142 events collected from 10 representative VB neurones of WT and α10/0 VB neurones at P8–9 and P12–14 (black curves, WT; grey curves, α10/0). The leftward shift in T90 values observed in VB neurones of P12–14 α10/0 mice indicates that synaptic expression of the α1 subunit is not a prerequisite for the shortening of the mIPSC decay that occurs in the second postnatal week. C and D, graphs illustrating the influence of development (P8–27) on the τW (C) and the peak amplitude (D) of mIPSCs recorded from VB neurones of WT (▪) and α10/0 (▵) mice. X-axis values are presented as the mean age of each developmental group studied. Data were obtained from 18–66 cells. E, summary bar graph illustrating the effects of zolpidem (100 nm, 1 μm) and Ro15-4513 (10 μm) upon the decay (τw, expressed as percentage change) of mIPSCs recorded from VB neurones of WT (black bars), α1H101R (open bars), α2H101R (dark grey bars) and α10/0 (light grey bars) mice. Data were obtained from 4–7 neurones. Error bars indicate s.e.m. Note that for the different developmental stages the standard error associated with each age group is also illustrated in C and D.
Figure 5
Figure 5. The tonic current of VB neurones increases with development
A, left panels, whole-cell recordings obtained from VB neurones of WT mice at P8–9 (Aa), P12–14 (Ab) and P23–27 (Ac). Right panels, the corresponding all-points histograms, normalized to the holding current recorded in the presence of bicuculline. Application of 30 μm bicuculline (grey) reveals a GABAA receptor-mediated tonic current, which increases in magnitude with development. B, a graph illustrating the developmental changes in mIPSC τw (left axis) and mIPSC peak, or tonic current amplitudes (right axis). X-axis values are presented as the mean age of each group studied. Note that the most dramatic changes to τw, peak amplitude and the magnitude of the tonic current occur at different developmental stages. Data were obtained from 18–66 cells for the mIPSCs and 7–25 cells for the tonic currents. Error bars indicate the s.e.m. Note that for the different developmental stages, the standard error associated with each age group is also illustrated in B.
Figure 6
Figure 6. An increase in extrasynaptic receptor expression primarily accounts for the developmental increase of the tonic conductance of VB neurones
A, the selective extrasynaptic GABAA receptor agonist THIP (gaboxadol, 1 μm) increases the magnitude of the tonic current in exemplar VB neurones of both P8–9 (Aa) and P15–22 (Ab) WT mice. However, note that the effect of the agonist is much greater for neurones from the older age group. B, the non-selective GAT inhibitor nipecotic acid (1 mm) increases the tonic current amplitude in exemplar VB neurones of both P8–9 (Ba) and P15–22 (Bb) WT mice. In common with THIP, the effect of nipecotic acid is greater for P15–22 than for P8–9 neurones. C, bar graph summarizing the change in holding current in response to the bath application of bicuculline (30 μm), THIP (1 μm) and nipecotic acid (1 mm) to WT VB neurones of P8–9 (open bars), P15–22 (black bars) and P23–27 (grey bars) mice. Data were obtained from 4 to 25 cells. Error bars indicate s.e.m.
Figure 7
Figure 7. Deletion of the α1 subunit does not influence the tonic current of VB neurones
A, a whole-cell recording from an exemplar α10/0 VB neurone. In common with WT VB neurones, the application of bicuculline reveals a large tonic conductance. Note the absence of synaptic currents under control conditions prior to bicuculline application. B, bar graph illustrating the magnitude of the tonic current in VB neurones of WT (black bar), α1H101R (grey bar), α10/0 (light grey bar) and β20/0 (open bar). Note that the tonic current recorded from β20/0, but not α1H101R or α10/0, VB neurones is significantly different from WT. The data for the β20/0 neurones are reproduced from Belelli et al. (2005) and are shown here for comparison. Data were obtained from 7–25 recordings. Asterisks in B indicate statistical differences (***P < 0.001). Error bars indicate s.e.m.
Figure 8
Figure 8. Comparative distribution of α1 (A, G, J), α2 (B, E, H, K) and α3 (C, F, I, L) subunit immunoreactivity in the thalamus at P10 (AC, E, F) and P20 (GL) in WT (AC, GI) and α10/0 (E, F, JL) mice
Parasagittal sections were processed for immunoperoxidase staining. A schematic drawing of the regions depicted is given in D. The α1 subunit is conspicuously absent in VB (VPL + VPM) of P10 WT mice, but increases rapidly thereafter. In contrast, the α2 subunit staining is moderate at P10 and decreases to background levels by P20 in both WT and α10/0 mice. Finally, the α3 subunit immunoreactivity, which is intense in Rt in both genotypes, is not detectable in VB at either age. Abbreviations: APT, anterior pretectal nucleus; fi, fimbria of the hippocampus; ic, internal capsule; LD, laterodorsal thalamic nucleus; Po, posterior thalamic nuclear group; Rt, reticular thalamic nucleus; st, stria terminalis; VPL; ventral posterolateral thalamic nucleus; VPM, ventral posteromedial thalamic nucleus; ZID, zona incerta, dorsal part; ZIV, zona incerta, ventral part. Scale bars, 100 μm (scale bar in F applies to A–F, scale bar in L applies to G–L).
Figure 9
Figure 9. Differential alterations in postsynaptic clustering of the α2 (green; AF) and α1 subunit (green; GH) and gephyrin (red, AH) during development of WT (left column) and α10/0 (right column) mice, visualized by immunofluorescence staining and confocal laser scanning microscopy
At P10 (A and B) most gephyrin clusters are colocalized with the α2 subunit in both genotypes. This fraction gradually decreases between P10 and P30 (AF, quantified in I), due to the loss of α2 subunit staining, which is replaced by the α1 subunit in WT (G, quantified in I), but not in mutants (H). As a result, gephyrin clusters in α10/0 mice remain isolated, and at P30, gephyrin forms large aggregates (F and H). I, quantification of colocalization patterns between gephyrin and the α1 or α2 subunit in WT and α10/0 mice. Pair-wise significant differences between age groups are indicated by symbols (*P < 0.05 compared to P30; #P < 0.05 compared to P20; +P < 0.05 compared to P15; °P < 0.05 compared to P10). J, quantification of gephyrin cluster density in WT and α10/0 mice. No change is evident in WT, whereas a 30% decrease occurs in mutants between P10 and P30; the same symbols are used as in I. Scale bar in F, 3 μm (applies to AF), in H, 10 μm (applies to G and H).
Figure 10
Figure 10. Comparative distribution of the α4 subunit immunoreactivity in VB of WT and α10/0 mice at P10 and P20, as illustrated by immunoperoxidase staining
A, B, A moderate staining for the α4 subunit selectively present in VB, but not in the nRT, is already evident at P10, with a similar distribution in both genotypes. C, D, The staining intensity increases until P20, without revealing differences between WT and α10/0 mice at this stage. EH, double immunofluorescence for gephyrin (red) and the α4 (green; E and G) or γ2 (green; F and H) subunit at P10 and P20 in α10/0 mice; the extrasynaptic localization of the α4 subunit is inferred from its lack of colocalization with gephyrin, despite the absence of the α1 subunit at either stage. Note that the γ2 subunit staining intensity decreases dramatically between P10 and P20, reflecting the loss of mIPSCs recorded electrophysiologically. Scale bars: D (applies for AD), 100 μm; H (applies for E–H), 2 μm.
Figure 11
Figure 11. GABA-ergic terminals remain unaffected in the VB of α10/0 mice during development, as seen by double immunofluorescence staining (A, B) of vGAT (green) and gephyrin (red)
A, at P30, the close apposition of both markers confirms the postsynaptic localization of gephyrin clusters in both genotypes, whereas large aggregates are not associated with gephyrin. B, at P60, most gephyrin clusters have disappeared and are replaced by aggregates. C, the density of vGAT positive terminals formed at P10 remains constant until adulthood and does not differ between WT and α10/0 mice. D, likewise, their size, as determined by cumulative distribution analysis, is comparable in adult and WT α10/0 mice, despite the loss of postsynaptic proteins occurring in the mutants. Scale bar in B, 2 μm (applies to A and B).

Similar articles

Cited by

References

    1. Agis-Balboa RC, Pinna G, Zhubi A, Maloku E, Veldic M, Costa E, Guidotti A. Characterization of brain neurones that express enzymes mediating neurosteroid biosynthesis. Proc Natl Acad Sci U S A. 2006;103:14602–14607. - PMC - PubMed
    1. Barnard EA, Skolnick P, Olsen RW, Mohler H, Sieghart W, Biggio G, Braestrup C, Bateson AN, Langer SZ. International Union of Pharmacology. XV. Subtypes of gamma-aminobutyric acidA receptors: classification on the basis of subunit structure and receptor function. Pharmacol Rev. 1998;50:291–313. - PubMed
    1. Belelli D, Herd MB, Mitchell EA, Peden DR, Vardy AW, Gentet L, Lambert JJ. Neuroactive steroids and inhibitory neurotransmission: mechanisms of action and physiological relevance. Neuroscience. 2006;138:821–829. - PubMed
    1. Belelli D, Peden DR, Rosahl TW, Wafford KA, Lambert JJ. Extrasynaptic GABAA receptors of thalamocortical neurones: a molecular target for hypnotics. J Neurosci. 2005;25:11513–11520. - PMC - PubMed
    1. Benson JA, Low K, Keist R, Mohler H, Rudolph U. Pharmacology of recombinant γ-aminobutyric acidA receptors rendered diazepam-insensitive by point-mutated α-subunits. FEBS Lett. 1998;431:400–404. - PubMed

Publication types

LinkOut - more resources