. 2008 Feb 1;586(3):817-33.
doi: 10.1113/jphysiol.2007.141929. Epub 2007 Dec 6.

Accumulation of cytoplasmic calcium, but not apamin-sensitive afterhyperpolarization current, during high frequency firing in rat subthalamic nucleus cells

Affiliations

Accumulation of cytoplasmic calcium, but not apamin-sensitive afterhyperpolarization current, during high frequency firing in rat subthalamic nucleus cells

Mark Teagarden et al. J Physiol. .

Abstract

The autonomous firing pattern of neurons in the rat subthalamic nucleus (STN) is shaped by action potential afterhyperpolarization currents. One of these is an apamin-sensitive calcium-dependent potassium current (SK). The duration of SK current is usually considered to be limited by the clearance of calcium from the vicinity of the channel. When the cell is driven to fire faster, calcium is expected to accumulate, and this is expected to result in accumulation of calcium-dependent AHP current. We measured the time course of calcium transients in the soma and proximal dendrites of STN neurons during spontaneous firing and their accumulation during driven firing. We compared these to the time course and accumulation of AHP currents using whole-cell and perforated patch recordings. During spontaneous firing, a rise in free cytoplasmic calcium was seen after each action potential, and decayed with a time constant of about 200 ms in the soma, and 80 ms in the dendrites. At rates higher than 10 Hz, calcium transients accumulated as predicted. In addition, there was a slow calcium transient not predicted by summation of action potentials that became more pronounced at high firing frequency. Spike AHP currents were measured in voltage clamp as tail currents after 2 ms voltage pulses that triggered action currents. Apamin-sensitive AHP (SK) current was measured by subtraction of tail currents obtained before and after treatment with apamin. SK current peaked between 10 and 15 ms after an action potential, had a decay time constant of about 30 ms, and showed no accumulation. At frequencies between 5 and 200 spikes s(-1), the maximal SK current remained the same as that evoked by a single action potential. AHP current did not have time to decay between action potentials, so at frequencies above 50 spikes s(-1) the apamin-sensitive current was effectively constant. These results are inconsistent with the view that the decay of SK current is governed by calcium dynamics. They suggest that the calcium is present at the SK channel for a very short time after each action potential, and the current decays at a rate set by the deactivation kinetics of the SK channel. At high rates, repetitive firing was governed by a fast apamin-insensitive AHP current that did not accumulate, but rather showed depression with increases in activation frequency. A slowly accumulating AHP current, also insensitive to apamin, was extremely small at low rates but became significant with higher firing rates.


Figures

Figure 1
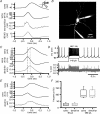
Figure 1. Changes in somatic and dendritic intracellular calcium during spontaneous firing in subthalamic neurons
A, bis-fura-2 image of a subthalamic neuron filled with indicator-loaded whole-cell recording pipette. Somatic (red) and dendritic (blue) regions of interest used for fluorescence measurements are shown. B, membrane potential during spontaneous rhythmic single spiking, and simultaneous changes in dendritic (blue) and somatic (red) fluorescence (excitation at 380 nm). Individual calcium samples are indicated by large dots. C and D, superimposed samples of fluorescence changes in the soma and dendrites associated with 16 superimposed spontaneous action potentials from the same cell shown in A and B. As the sampling was asynchronous with the action potentials, samples from various action potentials effectively sample randomly in time. E, superimposed action potentials used in C and D. F, a sample of calcium measurements from 32 action potentials from the same cell superimposed and then resampled at 2 ms resolution.
Figure 2
Figure 2. Correction of the resampled data for the sampling function
A, because each time point consists of a 10–30 ms exposure of the CCD, the high temporal resolution calcium time course obtained by superimposition is effectively convolved with a pulse of that duration. An example for a sampling period of 50 ms is shown for illustration. The period of CCD exposure associated with each sample point is indicated by the horizontal lines. Dashed and continuous lines illustrate deconvolution of the sampling function assuming a simple exponential decay of calcium after an action potential. This method predicts the fluorescence waveform indicated by the dotted line. B, the true fluorescence time course (corresponding to true calcium concentration change) for the resampled data from Fig. 1 (20 ms sampling period) are shown as continous lines. This method yields a corrected peak fluorescence and a time constant of fluorescence decay. C, peak amplitudes and decay time constants in the soma and proximal dendrites for a sample of 14 cells. Error bars show s.e.m. All data are from bis-fura-2 measurements.
Figure 3
Figure 3. Action potential generation and propagation in the dendrites of subthalamic neurons
A, whole-cell recording of a spontaneous action potential in the soma, the time derivative of somatic membrane potential, an extracellular recording, and a somatic cell-attached recording with a seal resistance similar to those for dendritic recordings. B, maximum intensity projection of an Alexa Fluor 594-filled subthalamic neuron showing electrodes in position on the soma and a dendrite at the locations used for the recordings shown in A–F. C, spike-triggered average of 100 spontaneous action potentials recorded from the soma (black lines show membrane potential and its temporal derivative) and simultaneous cell-attached recording from a dendrite (grey line) at the location indicated in B. Peaks of the derivative of somatic membrane potential and of the cell-attached dendritic recording are indicated by dashed lines. D, somatic whole-cell recording and simultaneous cell-attached recording of spontaneous firing and firing driven by current injection of 140 pA (average frequency, 68.1 s−1). E, spike-triggered average of 100 action potentials measured during 140 pA current injection as in D. F, range of firing frequencies measured in the soma and dendrite to somatic injection of 40 or 200 pA across all five cells tested. Note that the proximal dendritic action potential reliably follows high frequency firing.
Figure 4
Figure 4. Prediction of bis-fura-2 fluorescence changes during driven activity
A, prediction of single traces of fluorescence samples in the soma and dendrites using the method shown in Fig. 2. B, prediction of driven responses. Note that the prediction includes gradual accumulation of calcium during high frequency firing and slow decay of calcium to baseline levels after driven firing. While the dendritic prediction is relatively close, somatic fluorescence deviates from the prediction substantially, showing longer and slower changes during driven firing.
Figure 5
Figure 5. AHP currents evoked by voltage clamp pulses and simultaneous calcium imaging
A, low frequency activation produced fast calcium transients in the soma and dendrites associated with individual AHPs, and a slow accumulation of calcium that decayed gradually after the end of stimulation. AHP currents (with action currents and capacitive transient currents removed for clarity) show no corresponding accumulation of current. B, the same stimulation, but at 50 Hz. Note increased accumulation of calcium, both in the soma and dendrite, but no accumulation of outward current associated with the accumulation of calcium. Peak AHP current shows some depression after the first response, but decays after the last response at a rate comparable to that of individual AHP currents in A.
Figure 6
Figure 6. Measurement of apamin-sensitive and apamin-insensitive afterhyperpolarization currents in voltage clamp
A, exponential fits to the decay of AHP current in a single neuron, before (black) and after application of apamin (blue). The difference current (red) represents the apamin-sensitive component of the current. Exponential fits are shown in green. B, raw traces showing the same currents, and the voltage protocol used. Currents flowing during the depolarizing pulse are truncated. C, decay time constants obtained before or after apamin for 9 cells. Error bars show s.e.m.
Figure 7
Figure 7. The sensitivity of the slowly decaying component of AHP current to the slow and fast calcium buffers EGTA and BAPTA, respectively
Buffers were added to the electrode solutions and the amplitude of the late, slowly decaying component of the current was measured. Both BAPTA and EGTA were effective at reducing the peak size of the AHP current. The difference between the 2 mm EGTA and 2 mm BAPTA currents was statistically significant (t = 2.86, d.f. = 12, P < 0.02). Error bars show s.e.m. The numbers by each bar represent the sample sizes.
Figure 8
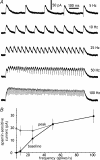
Figure 8. Response of the apamin-sensitive current during repetitive firing
A, difference currents obtained by evoking action potentials at a variety of rates. Apamin-sensitive AHP currents reach their peak within the first few action potentials, and there is very little accumulation of peak current during the train. AHP current decay at the end of a train is comparable across the full set of frequencies. Transients and action currents evoked by the current pulses are truncated. B, the steady-state peak current and baseline current (measured just before the onset of each voltage pulse) across the full range of frequencies for a sample of 11 cells. Error bars show s.e.m.
Figure 9
Figure 9. Depression of the apamin- and cadmium-insensitive AHP current
A, fast AHP currents evoked by voltage pulses at various frequencies after apamin treatment. Transients and action currents evoked during the voltage pulses have been removed to facilitate visualization of the AHP currents. Note there is some decrement in amplitude of AHP currents starting at 10 Hz, and increasing with frequency. There is also a slowly developing small outward current that accumulates, especially at the highest frequencies of stimulation. B, peak current during the repetitive stimulation for the cell shown in A. C, depression of fast AHP current in a sample of 11 cells. Error bars show s.e.m.
Figure 10
Figure 10. Slow tail current evoked after high frequency stimulation
This is the same accumulating current seen in Fig. 9A, but now measured as a post-stimulation tail current. A, tail current measured at 60 mV following a 200 Hz pulse train. Tail currents in one cell prior to apamin application (black), after apamin (red) and difference current (blue). Inset is the slowly deactivating current (measured 250 ms after the offset of the train) for a sample of 11 neurons before and after treatment with apamin or cadmium or both. B, slow tail current amplitude (measured as in A) versus frequency for a sample of 10 cells. C, decay time constants of decay of the apamin and cadmium-sensitive AHP current following single action potentials or at the end of a 200 Hz train, compared to the time constant of decay of the apamin-insensitive slow tail current after a 200 Hz train. Error bars show s.e.m.

Similar articles

Cited by

References

    1. Abel HJ, Lee JCF, Callaway JC, Foehring RC. Relationships between intracellular calcium and afterhyperpolarizations in neocortical pyramidal neurons. J Neurophysiol. 2003;91:324–335. - PubMed
    1. Armstrong WE, Smith BN, Tian M. Electrophysiological characteristics of immunochemically identified rat oxytocin and vasopressin neurones in vitro. J Physiol. 1994;475:115–128. - PMC - PubMed
    1. Atherton J, amd Bevan M. Ionic mechanisms underlying autonomous action potential generation in the somata and dendrites of GABAergic substantia nigra pars reticulata neurons in vitro. J Neurosci. 2005;25:8272–8281. - PMC - PubMed
    1. Augustine GJ, Santamaria F, Tanaka K. Local calcium signaling in neurons. Neuron. 2003;40:331–346. - PubMed
    1. Baldissera F, Gustafsson B, Parmiggiani F. Saturating summation of the afterhyperpolarization conductance in spinal motoneurones: a mechanism for ‘secondary range’ repetitive firing. Brain Res. 1978;146:69–82. - PubMed

Publication types

MeSH terms

LinkOut - more resources