. 2008 Mar;149(3):1338-49.
doi: 10.1210/en.2007-1137. Epub 2007 Dec 6.

Exendin-4 modulates diabetes onset in nonobese diabetic mice

Affiliations

Exendin-4 modulates diabetes onset in nonobese diabetic mice

Irene Hadjiyanni et al. Endocrinology. 2008 Mar.

Abstract

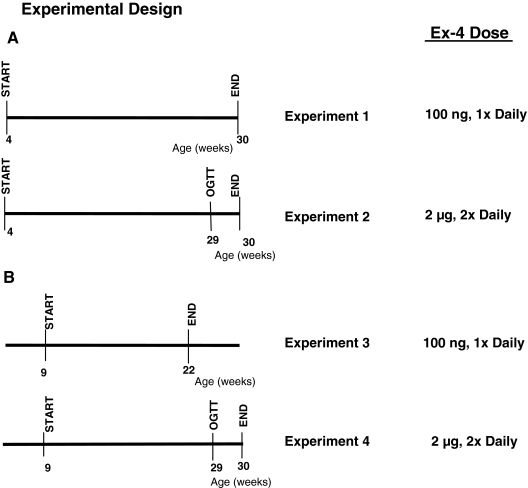
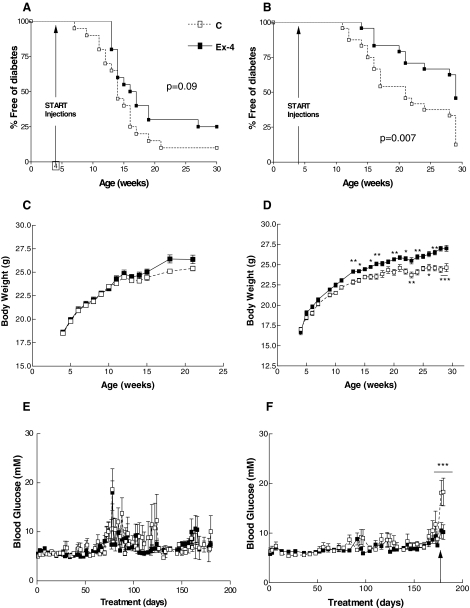
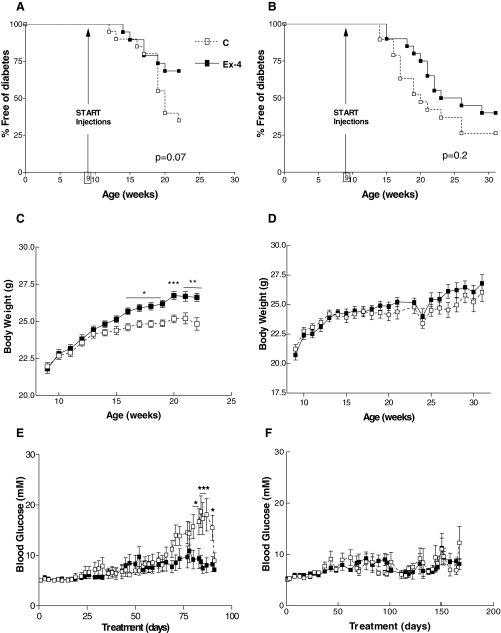
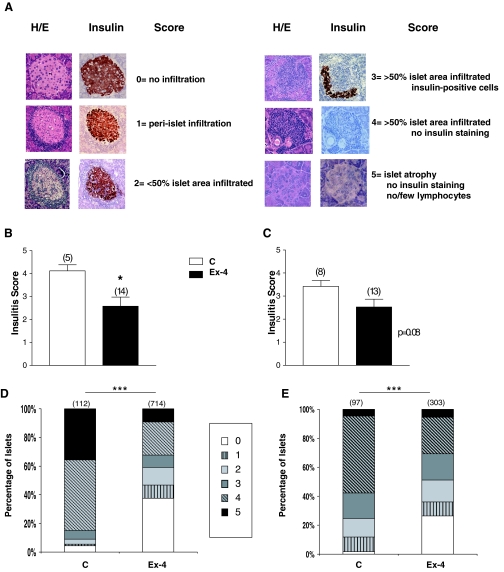
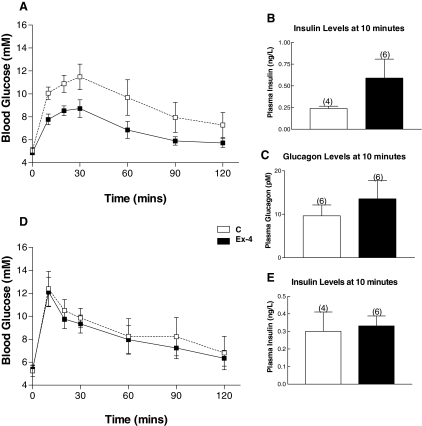
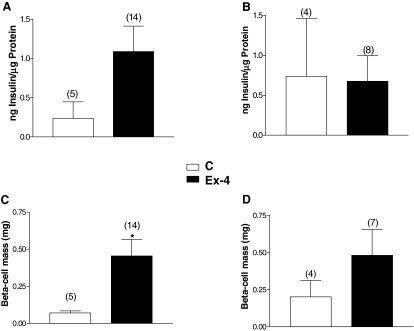
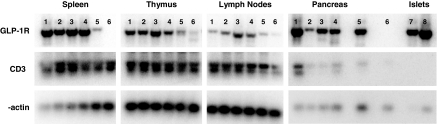
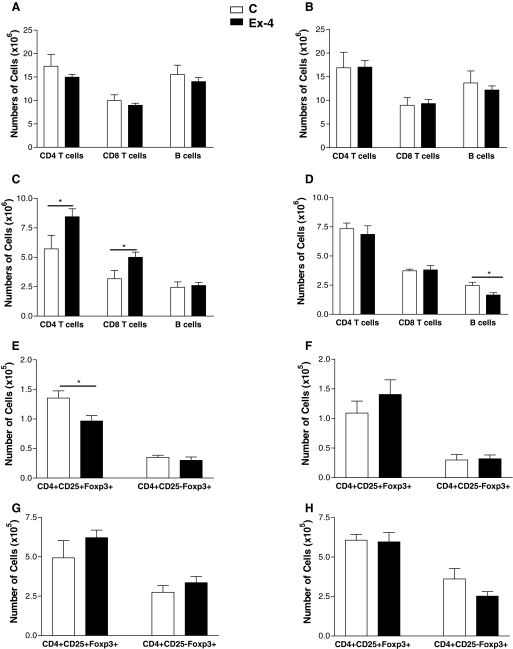
Activation of the glucagon-like peptide-1 receptor (GLP-1R) is associated with expansion of beta-cell mass due to stimulation of cell proliferation and induction of antiapoptotic pathways coupled to beta-cell survival. Although the GLP-1R agonist Exenatide (exendin-4) is currently being evaluated in subjects with type 1 diabetes, there is little information available about the efficacy of GLP-1R activation for prevention of experimental type 1 diabetes. We examined the consequences of exendin-4 (Ex-4) administration (100 ng once daily and 2 microg twice daily) on diabetes onset in nonobese diabetic mice beginning at either 4 or 9 wk of age prior to the onset of diabetes. Ex-4 treatment for 26 wk (2 microg twice daily) initiated at 4 wk of age delayed the onset of diabetes (P = 0.007). Ex-4-treated mice also exhibited a significant reduction in insulitis scores, enhanced beta-cell mass, and improved glucose tolerance. Although GLP-1R mRNA transcripts were detected in spleen, thymus, and lymph nodes from nonobese diabetic mice, Ex-4 treatment was not associated with significant changes in the numbers of CD4+ or CD8+ T cells or B cells in the spleen. However, Ex-4 treatment resulted in an increase in the number of CD4+ and CD8+ T cells in the lymph nodes and a reduction in the numbers of CD4+CD25+Foxp3+ regulatory T cells in the thymus but not in lymph nodes. These findings demonstrate that sustained GLP-1R activation in the absence of concomitant immune intervention may be associated with modest but significant delay in diabetes onset in a murine model of type 1 diabetes.


Figures

Figure 1
Figure 1
Summary of experimental design. The experiments were divided into two groups: in one set of experiments (A), Ex-4 administration was initiated when NOD mice were 4 wk of age; in a separate set of studies (B), Ex-4 administration initiated when NOD mice were 9 wk of age. Two different dose regimens of Ex-4, 100 ng once daily or 2 μg twice daily, were tested for each age group.
Figure 2
Figure 2
Analysis of the effects of Ex-4 on diabetes onset in 4-wk-old NOD mice. The 4-wk-old female NOD mice with normal blood glucose levels were injected with an equal volume (100 μl) of either saline (denoted as C) or Ex-4, 100 ng once daily (experiment 1, A, C, and E) or a higher dose of Ex-4, 2 μg twice daily (experiment 2, B, D, and F) for a total of 26 wk. During treatment, nonfasting blood glucose levels were checked in the morning, and mice were diagnosed as diabetic if they had a blood glucose level 17 mm or greater for 3 consecutive days. Diabetic mice were euthanized and removed from the study. A and B, Cumulative incidence of diabetes was plotted against age (weeks). Body weight and ambient blood glucose over the course of the experiment are shown in C and D and E and F, respectively. For F, an OGTT was performed on surviving normoglycemic NOD mice on d 177 of treatment, as indicated by the arrow. After the glucose challenge, ambient blood glucose levels were monitored daily until euthanasia (n = 20 mice/treatment group at the onset of treatment, n = 4–6 at end point for experiment 1; n = 24 mice/treatment group at onset, n = 8–13 at end point for experiment 2). For C–F, results are displayed as mean ± sem. *, P < 0.05; **, P < 0.01; and ***, P < 0.001, Ex-4 vs. control mice.
Figure 3
Figure 3
Analysis of the effects of Ex-4 on diabetes onset in 9-wk-old NOD mice. Treatment with Ex-4, 100 ng once daily (experiment 3, A, C, and E) or 2 μg twice daily (experiment 4, B, D, and F), was initiated in normoglycemic female NOD mice at 9 wk of age. The entire experiment was terminated according to a predetermined end point when 50% of mice in the control group developed diabetes (experiment 3) or until NOD mice reached 30 wk of age (experiment 4). Mice were monitored for diabetes onset by checking ambient blood glucose levels three times a week. Once the mice were diagnosed as diabetic, they were euthanized and removed from the study. A and B, Onset of diabetes in mice treated with Ex-4 and saline (denoted as C). Body weight measurements and nonfasting blood glucose levels during the treatment period are shown in C and D and E and F, respectively (n = 19–20 mice/treatment group at onset for both experiments 3 and 4, n = 8–13 at end point for experiment 3; n = 4–8 at end point for experiment 4). For C–F, results are displayed as mean ± sem. *, P < 0.05; **, P < 0.01; and ***, P < 0.001 Ex-4 vs. PBS-treated mice.
Figure 4
Figure 4
Treatment with Ex-4 results in reduction of islet infiltration. Pancreatic sections of normoglycemic mice that completed the treatment for experiment 2 (panels B and D) and experiment 3 (panels C and E) were assessed for the severity of lymphocytic infiltration. Panel A, Islets were given a score from 0 to 5, depending on the degree of lymphocytic infiltration and the proportion of islet surface area accounted for by insulin-positive cells. Serial sections of islets, stained with hematoxylin and eosin (H/E) and for insulin, are shown as a representation for each score. Data were plotted as the mean insulitis score (panels B and C) or the distribution of islets among insulitis scores (panels D and E). For panels B and C, insulitis scores were generated by dividing the sum of islet scores by the total number of islets of each mouse. The histograms for D and E represent the distribution of all islets analyzed among insulitis scores (n = 112–714 islets analyzed for panel D and 97–303 islets analyzed for panel E. The distribution of islets across insulitis scores for Ex-4-treated vs. control mice was analyzed using the χ2 test. Furthermore, the number of islets that were free of infiltration vs. infiltrated islets (i.e. islets that received a score of 0 vs. a score of > 0) was compared between Ex-4-treated and control mice, using the χ2 test. C, Saline-treated mice. Numbers above bar charts represent the number of animals (panels B and C) or total number of islets (panels D and E). *, P < 0.05; **, P < 0.01; and ***, P < 0.001 Ex-4 vs. PBS-treated mice. For panels B and C, results displayed as mean ± sem.
Figure 5
Figure 5
OGTTs in NOD mice treated with Ex-4, 2 μg twice daily. Panels A and D, An OGTT was performed at 29 wk of age on all mice [saline (C) and Ex-4-treated mice from experiments 2 and 4] that had a mean blood glucose less than 10 mm during week 28. Mice were fasted overnight, and an oral glucose load was administered by gavage (1.5 mg glucose per gram body weight). Tail blood was collected for insulin (panel B, experiment 2; panel E, experiment 4) and glucagon (panel C, experiment 2) determinations from 10–20 min after glucose administration. The numbers above the charts indicate the number of mice. For experiment 2 (panel A), the area under the curve for glucose measurements at time 0–60 min was 254.83 ± 33.12 vs. 399.58 ± 55.55 mm/min, P < 0.05 for Ex-4 vs. saline-treated mice. n = 4–9 mice per group for data shown in panels A–C and four to six mice per group for data shown in panels B and E. Results are displayed as mean ± sem.
Figure 6
Figure 6
NOD mice treated with Ex-4 2 μg twice daily for 26 wk have increased pancreatic insulin content and β-cell mass. Pancreatic insulin content (panels A and B) and β-cell mass (panels C and D) were measured at the end of the treatment period in all normoglycemic NOD mice that survived until the end of experiment 2 (panels A and C) and experiment 4 (panels B and D). Numbers above bar charts represent the number of animals. *, P < 0.05 Ex-4 vs. control (C) mice. Results displayed as mean ± sem.
Figure 7
Figure 7
GLP-1R mRNA transcripts are expressed in lymphoid tissue. Pancreas, islets, and lymphoid tissue were isolated for preparation of total cellular RNA, and the expression of GLP-1R transcripts was assessed in control and Ex-4-treated diabetic female NOD mice (lanes 1 and 2, respectively); control and Ex-4-treated normoglycemic female NOD mice (lanes 3 and 4); and age- and sex-matched C57BL/6 GLP-1R+/+ and GLP-1R−/− mice (lanes 5 and 6) as well as in islets of 12-wk-old NOD and C57BL/6 mice (lanes 7 and 8).
Figure 8
Figure 8
Lymphocyte subpopulations in NOD mice treated with saline (C) or 2 μg Ex-4. Single-cell populations from spleen, thymus, and lymph nodes of NOD mice that survived until the end of experiment 2 (panels A, C, E, and G) and experiment 4 (panels B, D, F, and H) were used for flow cytometry. The number of B and T cells were examined in the spleen (panels A and B) and lymph nodes (panels C and D). The absolute number of CD4+CD25+Foxp3+ cells (Tregs) and CD4+CD25-Foxp3+ cells was determined for the thymic (panels E and F) and lymph node (panels G and H) populations (n = 5–14 mice per group for data shown in panels A, C, E, and G and n = 4–8 mice per group for data shown in panels B, D, F, and H). Values are expressed as mean ± sem. Statistical differences between treatment and control animals in lymphocyte subpopulations were calculated using Student’s t test. *, P < 0.05.

References

    1. Baggio LL, Drucker DJ 2006 Therapeutic approaches to preserve islet mass in type 2 diabetes. Annu Rev Med 57:265–281 - PubMed
    1. Shapiro AM, Ricordi C, Hering BJ, Auchincloss H, Lindblad R, Robertson RP, Secchi A, Brendel MD, Berney T, Brennan DC, Cagliero E, Alejandro R, Ryan EA, DiMercurio B, Morel P, Polonsky KS, Reems JA, Bretzel RG, Bertuzzi F, Froud T, Kandaswamy R, Sutherland DE, Eisenbarth G, Segal M, Preiksaitis J, Korbutt GS, Barton FB, Viviano L, Seyfert-Margolis V, Bluestone J, Lakey JR 2006 International trial of the Edmonton protocol for islet transplantation. N Engl J Med 355:1318–1330 - PubMed
    1. Drucker DJ, Nauck MA 2006 The incretin system: glucagon-like peptide-1 receptor agonists and dipeptidyl peptidase-4 inhibitors in type 2 diabetes. Lancet 368:1696–1705 - PubMed
    1. Xu G, Stoffers DA, Habener JF, Bonner-Weir S 1999 Exendin-4 stimulates both β-cell replication and neogenesis, resulting in increased β-cell mass and improved glucose tolerance in diabetic rats. Diabetes 48:2270–2276 - PubMed
    1. Stoffers DA, Kieffer TJ, Hussain MA, Drucker DJ, Egan JM, Bonner-Weir S, Habener JF 2000 Insulinotropic glucagon-like peptide-1 agonists stimulate expression of homeodomain protein IDX-1 and increase β-cell mass in mouse pancreas. Diabetes 49:741–748 - PubMed

Publication types

MeSH terms