. 2008 Jan;118(1):281-93.
doi: 10.1172/JCI30989.

Small intestinal CD8+TCRgammadelta+NKG2A+ intraepithelial lymphocytes have attributes of regulatory cells in patients with celiac disease

Affiliations

Small intestinal CD8+TCRgammadelta+NKG2A+ intraepithelial lymphocytes have attributes of regulatory cells in patients with celiac disease

Govind Bhagat et al. J Clin Invest. 2008 Jan.

Abstract

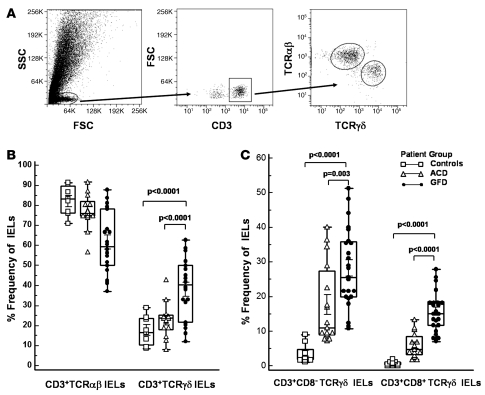
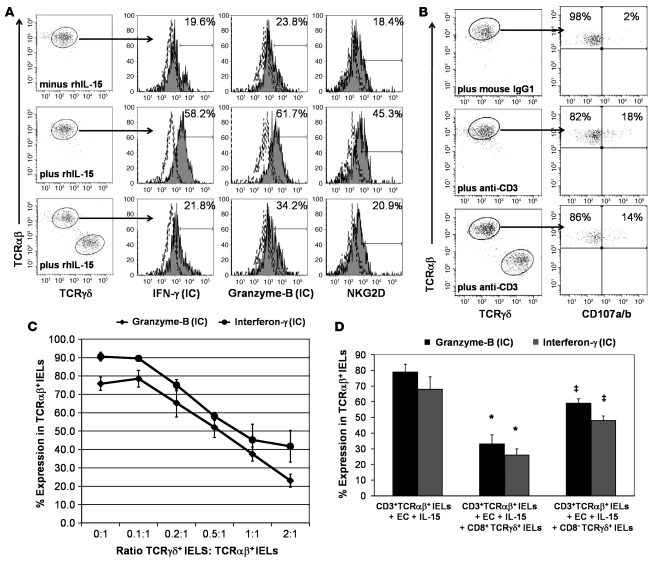
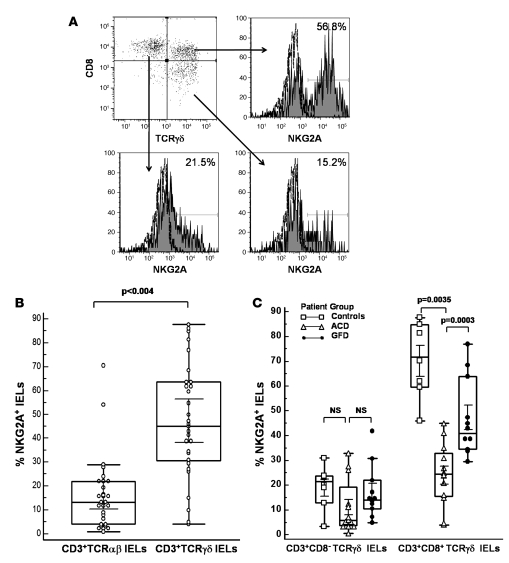
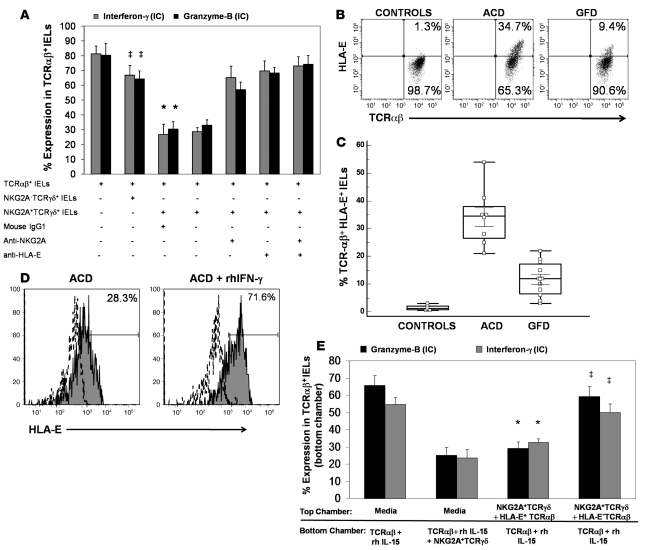
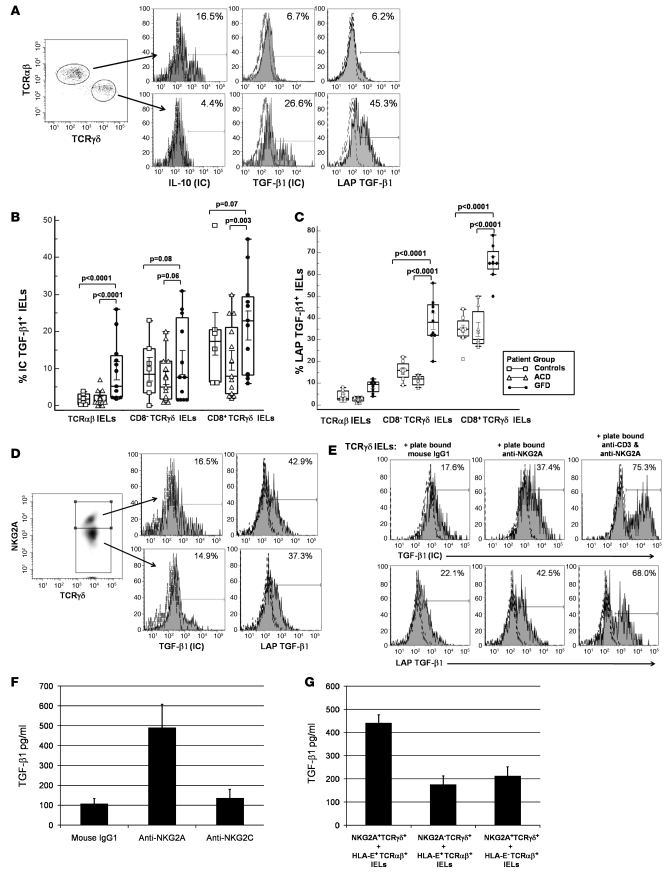
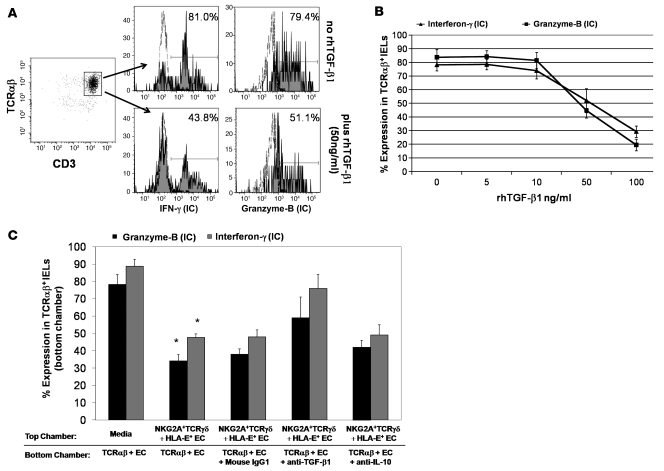
Intraepithelial lymphocytes (IELs) bearing the gammadelta TCR are more abundant in the small intestinal mucosa of patients with celiac disease (CD) compared with healthy individuals. However, their role in disease pathogenesis is not well understood. Here, we investigated the functional attributes of TCRgammadelta+ IELs isolated from intestinal biopsies of patients with either active celiac disease (ACD) or those on a gluten-free diet (GFD). We found that compared with individuals with ACD, individuals on GFD have a higher frequency of CD8+TCRgammadelta+ IELs that express the inhibitory NK receptor NKG2A and intracellular TGF-beta1. TCR triggering as well as cross-linking of NKG2A increased both TGF-beta1 intracellular expression and secretion in vitro. Coculture of sorted TCRgammadelta+NKG2A+ IELs, IL-15-stimulated TCRalphabeta+ IELs, and HLA-E+ enterocytes resulted in a decreased percentage of cytotoxic CD8+TCRalphabeta+ IELs expressing intracellular IFN-gamma and granzyme-B and surface NKG2D. This inhibition was partially abrogated by blocking either TGF-beta alone or both NKG2A and HLA-E. Thus, our data indicate that suppression was at least partially mediated by TGF-beta secretion as a result of engagement of NKG2A with its ligand, HLA-E, on enterocytes and/or TCRalphabeta+ IELs. These findings demonstrate that human small intestinal CD8+TCRgammadelta+ IELs may have regulatory potential in celiac disease.


Figures

Figure 1
Figure 1. Frequency of TCRγδ subsets in IELs from CD patients.
(A) Flow cytom­etry dot plots showing gating strategy for CD3+TCRαβ+ IELs and CD3+TCRγδ+ IELs. (B and C) Box-and-whisker plots representing frequencies, as assessed by flow cytometry, of: CD3+TCRαβ+ IELs and CD3+TCRγδ+ IELs in jejunal biopsy samples from ACD patients (n = 15), GFD patients (n = 23), and controls (n = 10) (B); CD3+CD8+TCRγδ+ IELs and CD3+CD8TCRγδ IELs in jejunal biopsies from ACD patients, GFD pat­ients, and controls (C) (P values calculated using Mann-Whitney U test).
Figure 2
Figure 2. TCRγδ IELs can suppress the cytotoxic programming of CD3+TCRαβ IELs.
(A) Representative flow cytometry histograms showing percentage of CD3+TCRαβ+ IELs sorted from the jejunal biopsies of an ACD patient expressing intracellular (IC) IFN-γ and granzyme B and cell-surface NKG2D in the absence and presence of 25 ng/ml of rhIL-15 (top and middle rows, respectively); and in the presence of 25 ng/ml of rhIL-15 without (middle row) and after addition of sorted CD3+CD8+TCRγδ+ IELs from the same patient at a 1:1 ratio (bottom row). CD3+TCRαβ+ IELs were cultured for 36 hours prior to flow cytometric analysis. Similar results were seen with samples from GFD patients. (B) Representative flow cytometry dot plots showing percentage of CD3+TCRαβ+ IELs that express CD107a/b after 4 hours of stimulation with plate-bound anti-CD3 in the presence (lower panels) or absence (upper panels) of CD3+TCRγδ+ IELs. (C) Percentage (mean ± SEM) of CD3+TCRαβ+ IELs expressing intracellular IFN-γ and granzyme B in the presence of rhIL-15 to which CD3+CD8+TCRγδ+ IELs had been added at different TCRγδ/TCRαβ IEL ratios. (D) Percentage (mean ± SEM) of CD3+TCRαβ IELs expressing intracellular IFN-γ and granzyme B in cocultures of CD3+TCRαβ IELs and ESA+ ECs, in the presence of rhIL-15. In parallel wells, CD3+CD8+TCRγδ+ IELs or CD3+CD8TCRγδ+ IELs were added at a 1:1 TCRγδ/TCRαβ IEL ratio (from 4 independent experiments). A statistically significant decrease (*) in the percentage of CD3+TCRαβ+ IELs expressing intracellular IFN-γ (P = 0.004) and granzyme-B (P = 0.003) was seen in wells to which CD3+CD8+TCRγδ+ IELs were added compared with wells with only CD3+TCRαβ+ IELs. No significant decrease () in the percentage of CD3+TCRαβ+ IELs expressing intracellular IFN-γ (P = 0.06) and granzyme B (P = 0.06) was observed in wells to which CD3+CD8TCRγδ+ IELs were added compared with wells with CD3+TCRαβ+ IELs only (P values determined by Wilcoxon’s signed-rank test).
Figure 3
Figure 3. Higher percentage of CD3+CD8+TCRγδ IELs express NKG2A in patients on GFD.
(A) Representative flow cytometry histograms showing percentage of CD3-gated CD8+TCRγδ, CD8+TCRγδ+, and CD8TCRγδ+ IELs (sorted from the jejunal biopsies of a GFD patient) expressing surface NKG2A. (B) Box-and-whisker plots comparing percentage of CD3+TCRαβ+NKG2A+ IELs with percentage of CD3+TCRγδ+NKG2A+ IELs. (C) Box and Whisker plots comparing frequencies of CD3+CD8+TCRγδ+ IELs and CD3+CD8TCRγδ+ IELs expressing NKG2A, from ACD patients (n = 15), GFD patients (n = 23), and controls (n = 10) (P values determined by Mann-Whitney U test).
Figure 4
Figure 4. Suppression by CD3+TCRγδ+ NKG2A+ IELs requires interaction with HLA-E.
(A) Percentage (mean ± SEM) of CD3+TCRαβ IELs expressing intracellular IFN-γ and granzyme B in cocultures of CD3+TCRαβ IELs with ESA+ ECs, in the presence of rhIL-15. Addition of CD3+TCRγδ+ NKG2A+ IELs to these cultures resulted in a statistically significant decrease (*) in the percentage of CD3+TCRαβ+ IELs expressing intracellular IFN-γ (P = 0.002) and granzyme B (P = 0.001). No significant decrease () in the percentage of CD3+TCRαβ+ IELs expressing intracellular IFN-γ (P = 0.1) and granzyme B (P = 0.3) was seen in cultures to which CD3+TCRγδ+ NKG2A IELs were added. When either 10 μg/ml anti-human NKG2A, 10 μg/ml anti-human HLA-E (MEM-E/06), or a cocktail of anti-human NKG2A and anti-human HLA-E were added to cultures containing CD3+TCRγδ+NKG2A+ IELs, the percentage of CD3+TCRαβ IELs expressing intracellular IFN-γ increased by 38.5% ± 10.2%, 43.0% ± 9.8% and 46.2% ± 9.5%, respectively, as did intracellular granzyme B–expressing CD3+TCRαβ IELs (27.0% ± 7.4%, 38.2% ± 9.1%, and 44.2% ± 10.2%). (B) Representative flow cytometry dot plots showing percentages of CD3+TCRαβ+ IELs that express HLA-E, from healthy controls, patients with ACD, and patients on GFD. (C) Box-and-whisker plots representing frequencies of CD3+TCRαβ+ IELs expressing HLA-E in jejunal biopsy samples from ACD patients (n = 8), GFD patients (n = 12), and controls (n = 7). (D) Representative flow cytometry histogram showing an increase in the percent of HLA-E–expressing CD3+TCRαβ+ IELs sorted from the jejunal biopsy of an ACD patient, after 24 hours treatment with 25 ng/ml of rhIFN-γ. (E) Percentage (mean ± SEM) of CD3+TCRαβ IELs expressing intracellular IFN-γ and granzyme B in cocultures of CD3+TCRαβ IELs treated with 25 ng/ml of rhIL-15 in the bottom chamber of a diffusion chamber system. When CD3+TCRγδ+NKG2A+ IELs were added to the bottom chamber or CD3+TCRγδ+NKG2A+ IELs with sorted HLA-E+CD3+TCRαβ IELs (from an ACD patient) were added to the top chamber, a significant decrease (*) in the percentage of CD3+TCRαβ IELs expressing intracellular IFN-γ (P = 0.004 and P = 0.006, respectively) and granzyme B (P = 0.003 for both) was seen. No significant decrease () in the percentage of CD3+TCRαβ IELs expressing intracellular IFN-γ (P = 0.09) and granzyme B (P = 0.08) was seen when CD3+TCRγδ+NKG2A+ IELs and HLA-ECD3+TCRαβ IELs were added to the top chamber (P values determined by Wilcoxon’s signed-rank test).
Figure 5
Figure 5. Frequency of CD3+CD8+TCRγδ+ IELs expressing intracellular TGF-β1 increases in patients on GFD.
(A) Representative flow cytometry histograms showing CD3+TCRαβ+ IELs and CD3+TCRγδ+ IELs expressing intracellular IL-10 and TGF-β1 and cell-surface LAP TGF-β1 in jejunal biopsies from a GFD patient. Cells were stimulated for 4 hours with PMA and ionomycin in the presence of brefeldin A. (B) Box-and-whisker plots comparing percentages of CD3+TCRαβ+ IELs, CD3+CD8+TCRγδ+ IELs, and CD3+CD8TCRγδ+ IELs expressing intracellular TGF-β1, from ACD patients (n = 15), GFD patients (n = 23), and controls (n = 10). (C) Box-and-whisker plots comparing percentages of CD3+TCRαβ+ IELs, CD3+CD8+TCRγδ+ IELs, and CD3+CD8TCRγδ+ IELs expressing cell-surface LAP TGF-β1, from ACD patients (n = 8), GFD patients (n = 11), and controls (n = 7). (D) Representative flow cytometry histograms showing percentage of CD3+TCRγδ+ NKG2A+ IELs and CD3+TCRγδ+ NKG2A IELs expressing intracellular TGF-β1 and cell-surface LAP TGF-β1 in jejunal biopsies from a GFD patient. (E) Representative flow cytometry histograms showing percentage of CD3+TCRγδ+ IELs (from an individual on GFD) expressing intracellular TGF-β1 (top row) and cell-surface LAP TGF-β1 (bottom row) after 24 hours culture in wells coated with 10 μg/ml mouse IgG1, 50 μg/ml anti-human NKG2A (clone 131411), or 50 μg/ml anti-human NKG2A plus 10 μg/ml anti-human CD3 (UCHT1; data representative of 3 independent experiments). (F) Levels (mean ± SEM pg/ml) of TGF-β1 in supernatants taken from cultures of CD3+TCRγδ+ IELs that were incubated for 24 hours in wells coated with 10 μg/ml mouse IgG1, 50 μg/ml anti-human NKG2A (clone 131411), or 50 μg/ml of anti-human NKG2C (clone 134522). (G) Levels (mean ± SEM pg/ml) of TGF-β1 in supernatants taken after 48 hours of cocultures of CD3+TCRγδ+ NKG2A+ IELs with HLA-E+CD3+TCRαβ IELs, CD3+TCRγδ+NKG2A IELs with HLA-E+CD3+TCRαβ IELs, or CD3+TCRγδ+NKG2A+ IELs with HLA-E CD3+TCRαβ IELs.
Figure 6
Figure 6. Suppression by CD3+TCRγδ+ NKG2A+ IELs is mediated by TGF-β1 secretion.
(A) Representative flow cytometry histograms showing percentage of CD3+TCRαβ IELs expressing intracellular IFN-γ (left) and granzyme B (right) in cocultures of CD3+TCRαβ IELs with ESA+ ECs were stimulated with rhIL-15 in the presence (bottom row) or absence (top row) of rhTGF-β1. (B) Percentage (mean ± SEM) of CD3+TCRαβ IELs expressing intracellular IFN-γ and granzyme B in cocultures of CD3+TCRαβ IELs with ESA+ ECs, in the presence of rhIL-15 to which different concentrations of rhTGF-β1 were added. Data shown are from 3 independent experiments. (C) Percentage (mean ± SEM) of CD3+TCRαβ+ IELs expressing intracellular IFN-γ and granzyme B in cocultures of CD3+TCRαβ+ IELs with ESA+ ECs, in the bottom chamber of a diffusion chamber system. When CD3+TCRγδ+NKG2A+ IELs with HLA-E+ ECs (from an ACD patient) were added to the top chamber, a significant decrease (*) in the percentage of CD3+TCRαβ IELs expressing intracellular IFN-γ (P = 0.006) and granzyme B (P = 0.003) was seen. However, inhibition of intracellular IFN-γ and granzyme B expression by CD3+TCRαβ IELs in the bottom chamber was blocked when 1 μg/ml of anti-human TGF-β1 antibody was added to the bottom chamber. This led to an increase in the percentage of CD3+TCRαβ+ IELs expressing intracellular IFN-γ by 28.0% ± 4.1% and granzyme B by 21.2% ± 9.3%, compared with cultures with mouse IgG1 (control). Addition of anti-human IL-10 did not block the suppressive effect of CD3+TCRγδ+NKG2A+ IELs; data shown from 4 independent experiments (P values determined by Wilcoxon’s signed-rank test).

References

    1. Green P.H., Jabri B. Celiac disease. Annu. Rev. Med. 2006;57:207–221. - PubMed
    1. Shan L., et al. Structural basis for gluten intolerance in celiac sprue. Science. 2002;297:2275–2279. - PubMed
    1. Gianfrani C., et al. Celiac disease association with CD8+ T cell responses: identification of a novel gliadin-derived HLA-A2-restricted epitope. . J. Immunol. 2003;170:2719–2726. - PubMed
    1. Meresse B., et al. Coordinated induction by IL15 of a TCR-independent NKG2D signaling pathway converts CTL into lymphokine-activated killer cells in celiac disease. Immunity. 2004;21:357–366. - PubMed
    1. Hue S., et al. A direct role for NKG2D/MICA interaction in villous atrophy during celiac disease. Immunity. 2004;21:367–377. - PubMed

Publication types

MeSH terms