. 2008 Jan;118(1):89-99.
doi: 10.1172/JCI32412.

Glypican-1 modulates the angiogenic and metastatic potential of human and mouse cancer cells

Affiliations

Glypican-1 modulates the angiogenic and metastatic potential of human and mouse cancer cells

Takuma Aikawa et al. J Clin Invest. 2008 Jan.

Abstract

Cells isolated from many types of human cancers express heparin-binding growth factors (HBGFs) that drive tumor growth, metastasis, and angiogenesis. The heparan sulfate proteoglycan glypican-1 (GPC1) is a coreceptor for HBGFs. Here we show that both cancer cell-derived and host-derived GPC1 are crucial for efficient growth, metastasis, and angiogenesis of human and mouse cancer cells. Thus downregulation of GPC1 in the human pancreatic cancer cell line PANC-1, using antisense approaches, resulted in prolonged doubling times and decreased anchorage-independent growth in vitro as well as attenuated tumor growth, angiogenesis, and metastasis when these cells were transplanted into athymic mice. Moreover, athymic mice that lacked GPC1 exhibited decreased tumor angiogenesis and metastasis following intrapancreatic implantation with either PANC-1 or T3M4 human pancreatic cancer cells and fewer pulmonary metastases following intravenous injection of murine B16-F10 melanoma cells. In addition, hepatic endothelial cells isolated from these mice exhibited an attenuated mitogenic response to VEGF-A. These data indicate that cancer cell- and host-derived GPC1 are crucial for full mitogenic, angiogenic, and metastatic potential of cancer cells. Thus targeting GPC1 might provide new avenues for cancer therapy and for the prevention of cancer metastasis.


Figures

Figure 1
Figure 1. Effects of GPC1 antisense expression on GPC1 protein levels.
(A) Effects of enzymatic treatment on immunoblotting. Sham-transfected cells and GPC1 antisense–expressing cells (clone GAS6) were incubated in the absence or presence of the indicated enzymes and subjected to immunoblotting using affinity-purified rabbit anti-GPC1 antibody as reported in Methods. (B) Total cell lysates from sham-transfected and from both antisense-expressing clones as well as the corresponding conditioned media were incubated with heparitinase and chondroitinase ABC and subjected to immunoblotting as described above. Membranes from cell lysates were reprobed with an anti-ERK2 antibody to confirm equivalent loading of lanes. Each panel is representative of 2 distinct experiments.
Figure 2
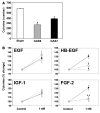
Figure 2. Cell growth assays.
(A) Effects of GPC1 levels on basal anchorage-independent growth. Sham-transfected PANC-1 cells and GPC1 antisense–expressing clones were seeded in 6-well plates (3,000/well) in complete medium containing 0.3% agar. After 14 days, colonies having more than 20 cells were counted. Data indicate the mean ± SEM of triplicate determinations from 3 experiments. #P < 0.01 compared with sham-transfected cells. (B) Effects of GPC1 levels on growth factor–stimulated anchorage-independent growth. Sham-transfected (filled symbols) and GPC1 antisense mRNA–expressing PANC-1 cells (open symbols) were seeded in 6-well plates (3,000/well) in serum-free medium containing 0.3% agar. Serum-free medium containing 1 nM HB-EGF, FGF2, EGF, or IGF-1 was added every 4 days. After 14 days, colonies having more than 20 cells were counted. Data are expressed as percentage change from the respective controls (mean ± SEM) of 3 determinations per experiment from 3 separate experiments. *P < 0.05 and **P < 0.03 compared with control.
Figure 3
Figure 3. Effects of GPC1 levels on tumor growth.
(A) Representative tumors. GAS6 cells consistently formed smaller tumors than sham-transfected cells. The mice bearing GAS tumors appeared healthy. By contrast, the mice bearing tumors from sham-transfected cells had to be terminated due to their cachectic appearance, tumor size, and tendency of the tumors to develop surface ulcerations. (B) Tumor growth curves. Exponentially growing (2 × 10⁶) sham-transfected PANC-1 cells (filled diamonds) and GAS7 (open triangles) and GAS6 (open squares) cells were injected subcutaneously in athymic mice, and tumor growth was measured weekly. Tumor volume was determined by the equation: volume = (l × h × w) × À /4, where l is length, h is height, and w is width of the tumor. Data are mean ± SEM from 9 tumors for sham-transfected PANC-1 cells and for each of the 2 GAS clones.
Figure 4
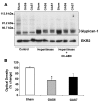
Figure 4. GPC1 expression in tumor xenografts.
(A) Immunoblotting. Tumors from sham-transfected and GAS PANC-1 cells (GAS6 and GAS7) were homogenized and incubated with control buffer, heparitinase, or heparitinase and chondroitinase ABC (Ch-ABC). Protein lysates were subjected to immunoblotting using affinity-purified rabbit anti-GPC1 antibody as reported in Methods. Membranes from cell lysates were reprobed with an anti-ERK2 antibody to confirm equivalent loading of lanes. (B) Densitometric analysis. Frozen lysates for immunoblotting from 6 sham, 5 GAS6, and 4 GAS7 tumors were subjected to densitometry. *P < 0.005 compared with sham.
Figure 5
Figure 5. Effects of GPC1 levels on CD31 immunoreactivity in subcutaneous tumors.
(A) Analysis of vessel number. Morphometric analysis of vessel number was performed as described in Methods, using an anti-CD31 antibody. Data are based on immunohistochemical staining of 10 tumors from sham-transfected PANC-1 cells, 7 tumors from GAS6 cells, and 10 tumors from GAS7 cells. (B) Analysis of vessel area. Morphometric analysis on the same tumors was carried out based on the area occupied by the vessels. Data are the means ± SEM. *P < 0.05 and **P < 0.01 compared with sham.
Figure 6
Figure 6. Effects of GPC1 levels on PCNA immunoreactivity in subcutaneous tumors.
Morphometric analysis of PCNA immunoreactivity was performed as described in Methods, using 10 tumors from sham-transfected PANC-1 cells, 6 tumors from GAS6 cells, and 9 tumors from GAS7 cells. Data are means ± SEM. *P < 0.01 compared with sham.
Figure 7
Figure 7. Effects of GPC1 levels on phospho-MAPK in subcutaneous tumors.
(A) Immunoblotting for active ERK1/2. Lysates from 10 tumors from sham-transfected PANC-1 cells, 8 tumors from GAS6 cells, and 6 tumors from GAS7 cells were subjected to immunoblotting with anti–phospho-MAPK antibody as described in Methods. (B) Densitometric analysis. Band intensities for active ERK1 and active ERK2 were normalized to total ERK2 (loading control). Data are means ± SEM. *P < 0.05 compared with sham.
Figure 8
Figure 8. Effects of GPC1 levels on the expression of proangiogenic factors in PANC-1 cells in culture.
RNA extracted from sham-transfected PANC-1 cells and GAS6 cells was subjected to real-time quantitative PCR. Relative expression levels were determined in triplicate. Data are means ± SEM from 3 different experiments. *P < 0.01 compared with the corresponding sham.
Figure 9
Figure 9. Effects of GPC1 levels on the expression of proangiogenic factors in PANC-1–derived subcutaneous tumors.
RNA extracted from tumors derived from sham-transfected PANC-1 cells and 2 GPC1 antisense PANC-1 clones was subjected to real-time quantitative PCR. Relative expression levels were determined in triplicate. Data are the means ± SEM from 6 sham and 4 GAS6 and 3 GAS7 tumors. *P < 0.01 when compared with the corresponding sham.
Figure 10
Figure 10. Angiopoietin and Tie2 immunohistochemistry.
Immunohistochemical staining for angiopoietin-1, angiopoietin-2, and Tie2 was performed as described in Methods. (A) Angiopoietin-1; (B) angiopoietin-2; (C) Tie2; (D) control staining in the absence of a primary antibody. Original magnification, ×100 (A and D); ×200 (B and C).
Figure 11
Figure 11. Comparison of metastases in WT and GPC1-null mice.
PANC-1 (A and B) and T3M4 (C and D) human pancreatic cancer cells were injected into the pancreas of WT (A and C) and GPC1-null (B and D) mice, as described in the legends to Table 2 (PANC-1) and Table 3 (T3M4). Metastatic lesions were visible in the mesentery of WT mice, but not in GPC1-null mice.
Figure 12
Figure 12. Effect of endogenous GPC1 levels on pulmonary metastasis of murine melanoma cells.
Exponentially growing (1 × 10⁵) murine B16-F10 melanoma cells were injected into the lateral vein of mice. Pulmonary metastases were counted 20–25 days later. Data are means ± SEM from 16 WT mice and 20 GPC1-null mice. *P < 0.006 compared with WT.
Figure 13
Figure 13. Effects of endogenous GPC1 levels on endothelial cell proliferation.
Endothelial cells isolated from WT or GPC1-null mice were plated in triplicate on fibronectin-coated 96-well plates, serum-starved overnight, and incubated for 48 h in the presence of 0.5% BSA (control) or 50 ng/ml VEGF-A. Data are means ± SEM. *P < 0.05 compared with control.
Figure 14
Figure 14. Schematic representation of the role of GPC1 in tumor angiogenesis and metastasis.
Endothelial cells expressing VEGF receptors, Tie2, and GPC1 (iv) are shown interacting with cancer cell–derived VEGF-A, angiopoietin-1, and angiopoietin-2 (i), cancer cell–derived GPC1 acting in trans (ii), shed GPC1 (iii), and fibroblast-derived GPC1 (v). Thus host- and tumor-derived GPC1 combine to contribute to tumor angiogenesis.

References

    1. McKenna S., Eatock M. The medical management of pancreatic cancer: a review. Oncologist. 2003;8:149–160. - PubMed
    1. Jemal A., et al. Cancer statistics. CA Cancer J. Clin. 2007;57:43–66. - PubMed
    1. Perrimon N., Bernfield M. Cellular functions of proteoglycans — an overview. Semin. Cell Dev. Biol. 2001;12:65–67. - PubMed
    1. De Cat B., David G. Developmental roles of the glypicans. Semin. Cell Dev. Biol. 2001;12:117–125. - PubMed
    1. Filmus J. Glypicans in growth control and cancer. Glycobiology. 2001;11:19R–23R. - PubMed

Publication types

MeSH terms