

Probability of HIV transmission during acute infection in Rakai, Uganda
- PMID: 18064559
- PMCID: PMC2614120
- DOI: 10.1007/s10461-007-9329-1
Probability of HIV transmission during acute infection in Rakai, Uganda
Abstract
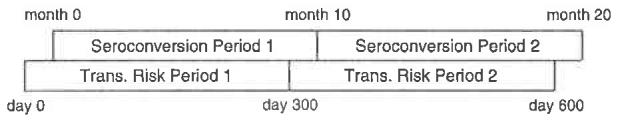
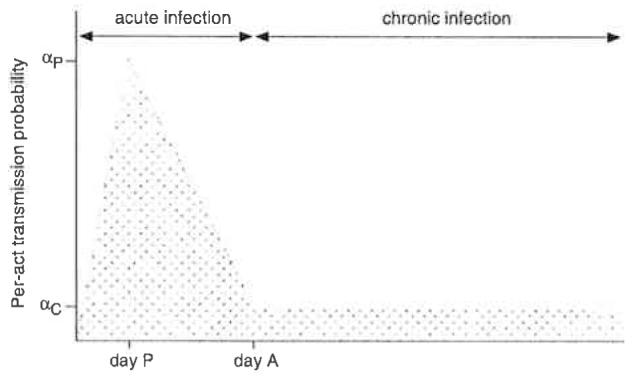
Accurate estimates of the probability of HIV transmission during various stages of infection are needed to inform epidemiological models. Very limited information is available about the probability of transmission during acute HIV infection. We conducted a secondary analysis of published data from the Rakai, Uganda seroconversion study. Mathematical and computer-based models were used to quantify the per-act and per-partnership transmission probabilities during acute and chronic HIV infection, and to estimate how many of the transmission events reported in the Rakai study were due to acute-phase HIV transmission. The average per-act transmission probability during acute infection equaled 0.03604 vs. 0.00084 for chronic HIV infection. Overall, HIV was transmitted during acute infection in 46.5% of 23 "incident index partner couples." Acute-phase transmission accounted for 89.1% of all transmission events in the first 20 months of follow-up. These results highlight the substantial risk of transmission during acute HIV infection.
Figures
References
-
- Association of State and Territorial Health Officials Acute HIV infection—an opportunity to enhance primary prevention. ASTHO Bulletin. 2006;(March):1–16.
-
- Brookmeyer R, Gail MH. AIDS epidemiology: A quantitative approach. Oxford University Press; New York: 1994.
-
- Busch MP, Satten GA. Time course of viremia and antibody seroconversion following human immunodeficiency virus exposure. American Journal of Medicine. 1997;102:117–126. - PubMed
-
- Cohen MS, Pilcher CD. Amplified HIV transmission and new approaches to HIV prevention. Journal of Infectious Diseases. 2005;191:1391–1393. - PubMed
-
- Gray RH, Li X, Kigozi G, Serwadda D, Nalugoda F, Watya S, Reynolds SJ, Wawer M. The impact of male circumcision on HIV incidence and cost per infection prevented: A stochastic simulation model from Rakai, Uganda. AIDS. 2007;21:845–850. - PubMed
Publication types
MeSH terms
Grants and funding
LinkOut - more resources
Full Text Sources
Medical
