Multicenter Study
. 2009 Feb;30(2):355-68.
doi: 10.1002/hbm.20511.

Assessment of the increase in variability when combining volumetric data from different scanners

Affiliations
Multicenter Study

Assessment of the increase in variability when combining volumetric data from different scanners

Santiago Reig et al. Hum Brain Mapp. 2009 Feb.

Abstract

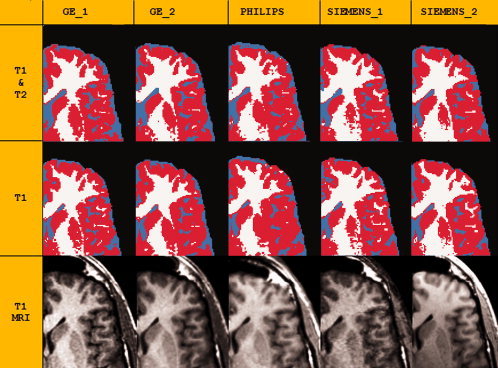
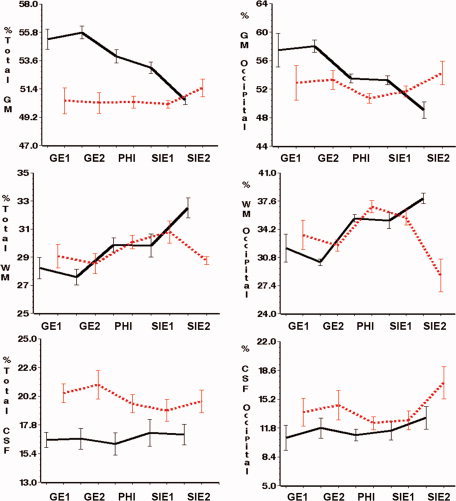
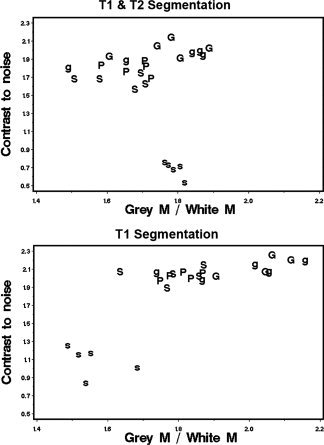
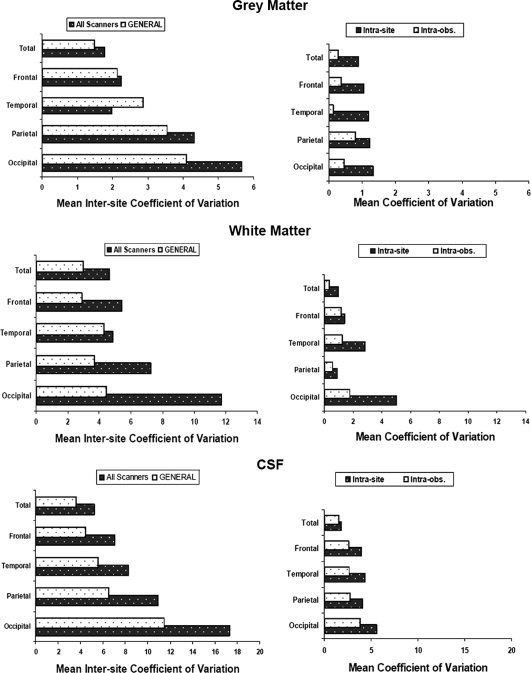
In multicenter MRI studies, pooling of volumetric data requires a prior evaluation of compatibility between the different machines used. We tested the compatibility of five different scanners (2 General Electric Signa, 2 Siemens Symphony, and a Philips Gyroscan) at five different sites by repeating the scans of five volunteers at each of the sites. Using a semiautomatic method based on the Talairach atlas, and SPM algorithms for tissue segmentation (multimodal T1 and T2, or T1-only), we obtained volume measurements of the main brain lobes (frontal, parietal, occipital, temporal) and for each tissue type. Our results suggest that pooling of multisite data adds small error for whole brain measurements, intersite coefficient of variation (CV) ranging from 1.8 to 5.2%, respectively, for GM and CSF. However, in the occipital lobe, intersite CV can be as high as 11.7% for WM and 17.3% for CSF. Compared with the intersite, intrasite CV values were always much lower. Whenever possible, T1 and T2 tissue segmentation methods should be used because they yield more consistent volume measurements between sites than T1-only, especially when some of the scans were obtained with different sequence parameters and pixel size from those of the other sites. Our study shows that highest compatibility among scanners would be obtained using equipments of the same manufacturer and also image acquisition parameters as similar as possible. After validation, data from a specific ROI or scanner showing values markedly different from the other sites might be excluded from the analysis.


Figures

Figure 1
Figure 1
Zoomed section of an axial view of the same subject scanned at five different centers, to illustrate qualitative differences of MRI and of tissue segmentation. Top: Results of tissue segmentation, using T1‐only or T1 and T2 data; tissue types are color coded: GM = red; WM = white; CSF = cyan. Bottom: MR scans. Scans were all registered to the image obtained with the Philips scanner. Note that the segmentation of WM and GM tissue seems more accurate in multimodal segmentation because the cortex distribution along the sulci and gyri looks more realistic, whereas the higher volumes of CSF obtained using T1 and T2 segmentation seem to arise from an exaggeration of sulcal spaces.
Figure 2
Figure 2
Plots showing the volumetric measurements obtained at each site using T1 and T2 (light, dashed line) and T1‐only (black, solid line) tissue segmentation (see Methods for details). Bars represent 1 SD around the mean. Lines join within site mean values. Left column: Whole‐brain volumes (data expressed as a percentage of intracranial volume). Right column: Tissue volumes of the occipital lobe (data expressed as a percentage of the total volume for the occipital lobe). [Color figure can be viewed in the online issue, which is available at www.interscience.wiley.com.]
Figure 3
Figure 3
Scatter plots showing the relationship between contrast‐to‐noise ratio and GM/WM ratio for each subject scanned. Top data obtained using T1 and T2 segmentation. Bottom: Data obtained using T1 scans only. Data points are labeled with the scanner used. G: GE_1; g: GE_2; P: Philips; S: SIEMENS_1; s: SIEMENS_2. To facilitate the comparison between the two segmentation methods, the same scale was used in both plots.
Figure 4
Figure 4
Estimation of the error in our volume measurements in whole‐brain and lobar data of GM, WM, and CSF due to different sources: intersite, intrascanner, and intrarater (see Methods for details). Left column: All scanners; bars show average of within subject coefficients of variation between scanners in the five sites. GENERAL; bars show the mean coefficient of variation of the five subjects in the GE‐1 and GE‐2 sites only. Right column: Intrasite; variability due to MRI acquisition (subject positioning in the scanner). Intraobs; variability due to manual intervention in the ROI segmentation method (see Methods). To facilitate comparisons, notice that for each tissue type, the range of values in the horizontal axis is the same for left and right columns.

References

    1. Agartz I,Okuguwa G,Nordstrom M,Greitz D,Magnotta V ( 2001): Reliability and reproducibility of brain tissue volumetry from segmented MR scans. Eur Arch Psychiatry Clin Neurosci 251: 255–261. - PubMed
    1. Andreasen NC,Rajarethinam R,Cizadlo T,Arndt S,Swayze VW II,Flashman LA,O'Leary DS,Ehrhardt JC,Yuh WT ( 1996): Automatic atlas‐based volume estimation of human brain regions from MR images. J Comput Assist Tomogr 20: 98–106. - PubMed
    1. Ashburner J,Friston KJ ( 1997): Multimodal image coregistration and partitioning—A unified framework. Neuroimage 6: 209–217. - PubMed
    1. Ashburner J,Friston KJ ( 2000): Voxel‐based morphometry—The methods. Neuroimage 11: 805–821. - PubMed
    1. Bland JM,Altman DG ( 1996): Statistics notes: Measurement error proportional to the mean. BMJ 313: 106. - PMC - PubMed

Publication types

MeSH terms