

High b-value diffusion (b = 3000 s/mm2) MR imaging in cerebral gliomas at 3T: visual and quantitative comparisons with b = 1000 s/mm2
- PMID: 18065512
- PMCID: PMC8118876
- DOI: 10.3174/ajnr.A0842
High b-value diffusion (b = 3000 s/mm2) MR imaging in cerebral gliomas at 3T: visual and quantitative comparisons with b = 1000 s/mm2
Abstract
Background and purpose: High b-value diffusion-weighted imaging (DWI) provides different features not appreciated at lower b-value and have been recently studied in several clinical issues. The purpose of this study was to assess whether DWI at b = 3000 s/mm(2) is more useful in discriminating high-grade and low-grade gliomas than DWI at b = 1000 s/mm(2) at 3T.
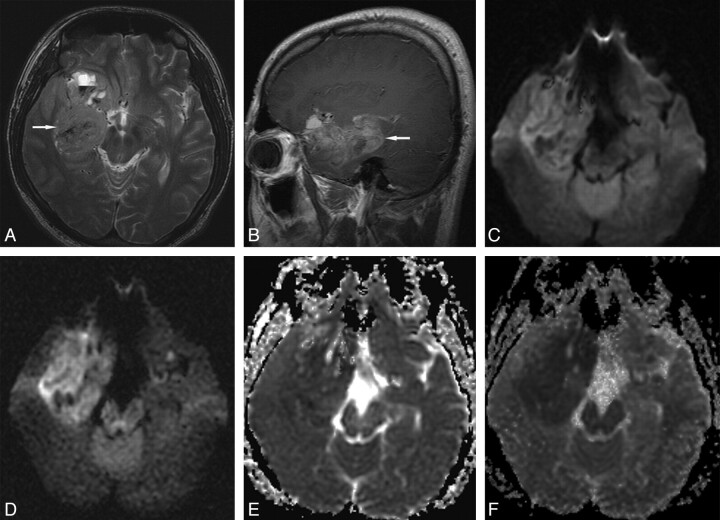
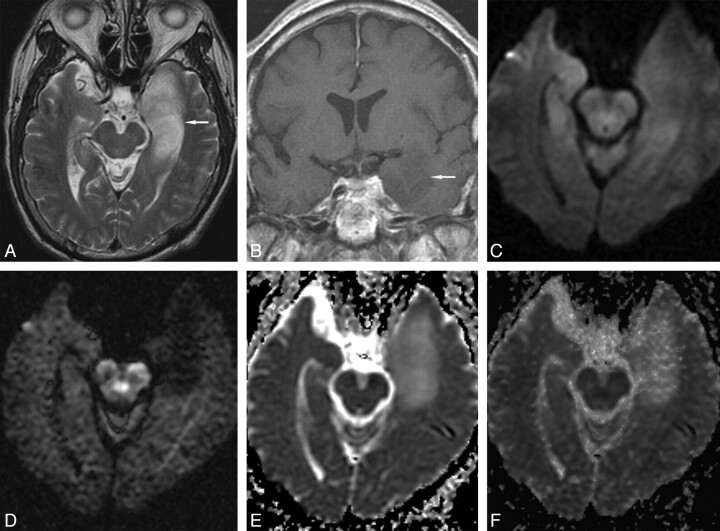
Materials and methods: DWIs at both b = 1000 and 3000 s/mm(2) were performed at 3T in 62 patients, 49 high-grade gliomas (20 World Health Organization [WHO] grade III and 29 grade IV) and 13 low-grade gliomas (13 grade II). Visual assessments based on 5-point scaled evaluations, receiver operating characteristic (ROC) curve analysis, and quantitative assessment based on DWI signal intensity (SI) ratio (tumor SI/normal SI) and apparent diffusion coefficient (ADC) values were compared between DWIs at b = 1000 and 3000 s/mm(2).
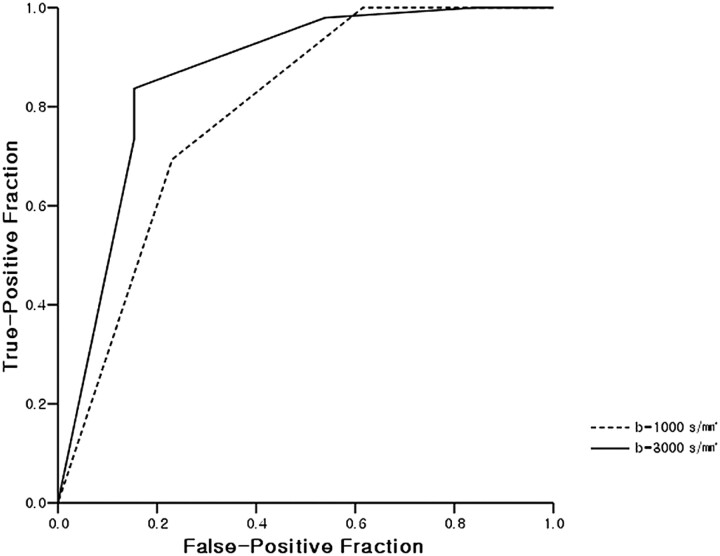
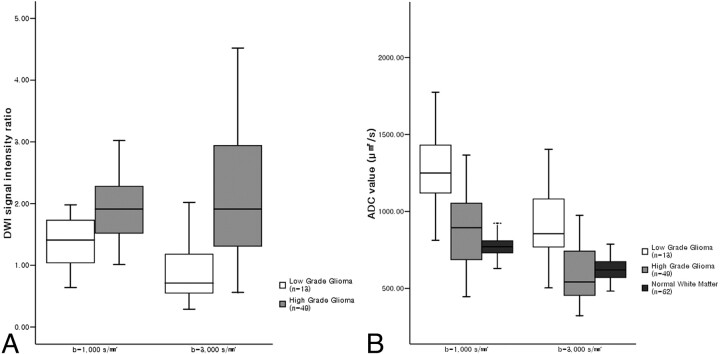
Results: By visual assessment, DWI at b = 3000 s/mm(2) showed more conspicuous hyperintensity in high-grade gliomas and hypointensity in low-grade gliomas than DWI at b = 1000 s/mm(2). Sensitivity and specificity at b = 3000 s/mm(2) were higher than at b = 1000 s/mm(2) (83.7%, 84.6% vs 69.4%, 76.9%, respectively). Quantitative assessments showed that mean SI ratio of high-grade gliomas was significantly higher than that of low-grade gliomas at both b-values. The mean ADC value of high-grade gliomas was significantly lower than that of low-grade gliomas at both b-values. The difference between the SI ratios of high-grade and low-grade gliomas was significantly larger at b = 3000 s/mm(2) than at b = 1000 s/mm(2).
Conclusion: DWI at b = 3000 s/mm(2) is more useful than DWI at b = 1000 s/mm(2) in terms of discriminating high-grade and low-grade gliomas at 3T.
Figures
Similar articles
-
Measurements of diagnostic examination performance using quantitative apparent diffusion coefficient and proton MR spectroscopic imaging in the preoperative evaluation of tumor grade in cerebral gliomas.Eur J Radiol. 2011 Nov;80(2):462-70. doi: 10.1016/j.ejrad.2010.07.017. Epub 2010 Aug 13. Eur J Radiol. 2011. PMID: 20708868
-
Grading Gliomas Capability: Comparison between Visual Assessment and Apparent Diffusion Coefficient (ADC) Value Measurement on Diffusion-Weighted Imaging (DWI).Asian Pac J Cancer Prev. 2020 Feb 1;21(2):385-390. doi: 10.31557/APJCP.2020.21.2.385. Asian Pac J Cancer Prev. 2020. PMID: 32102515 Free PMC article.
-
Intravoxel incoherent motion diffusion-weighted MR imaging of gliomas: feasibility of the method and initial results.Neuroradiology. 2013 Oct;55(10):1189-96. doi: 10.1007/s00234-013-1229-7. Epub 2013 Jul 14. Neuroradiology. 2013. PMID: 23852430
-
Accuracy of ADC derived from DWI for differentiating high-grade from low-grade gliomas: Systematic review and meta-analysis.Medicine (Baltimore). 2020 Feb;99(8):e19254. doi: 10.1097/MD.0000000000019254. Medicine (Baltimore). 2020. PMID: 32080132 Free PMC article.
-
Diffusion-weighted MRI as a biomarker for treatment response in glioma.CNS Oncol. 2012 Nov;1(2):169-80. doi: 10.2217/cns.12.25. CNS Oncol. 2012. PMID: 23936625 Free PMC article. Review.
Cited by
-
Diffusion MRI harmonization via personalized template mapping.Hum Brain Mapp. 2024 Apr;45(5):e26661. doi: 10.1002/hbm.26661. Hum Brain Mapp. 2024. PMID: 38520363 Free PMC article.
-
Usefulness of 3T split acquisition fast spin-echo diffusion-weighted imaging for differentiating pituitary abscess from other sellar cystic lesions: a preliminary study.Neuroradiology. 2025 May;67(5):1329-1336. doi: 10.1007/s00234-024-03531-8. Epub 2025 Mar 21. Neuroradiology. 2025. PMID: 40116944
-
High b-Value Diffusion MRI to Differentiate Recurrent Tumors from Posttreatment Changes in Head and Neck Squamous Cell Carcinoma: A Single Center Prospective Study.Biomed Res Int. 2016;2016:2865169. doi: 10.1155/2016/2865169. Epub 2016 Jun 7. Biomed Res Int. 2016. PMID: 27376081 Free PMC article.
-
Diffusion-weighted imaging and the apparent diffusion coefficient on 3T MR imaging in the differentiation of craniopharyngiomas and germ cell tumors.Neurosurg Rev. 2016 Apr;39(2):207-13; discussion 213. doi: 10.1007/s10143-015-0660-0. Epub 2015 Aug 18. Neurosurg Rev. 2016. PMID: 26280640
-
Demonstration of Non-Gaussian Restricted Diffusion in Tumor Cells Using Diffusion Time-Dependent Diffusion-Weighted Magnetic Resonance Imaging Contrast.Front Oncol. 2016 Aug 2;6:179. doi: 10.3389/fonc.2016.00179. eCollection 2016. Front Oncol. 2016. PMID: 27532028 Free PMC article.
References
-
- Bammer R. Basic principles of diffusion-weighted imaging. Eur J Radiol 2003;45:169–84 - PubMed
-
- Lutsep HL, Albers GW, DeCrespigny A, et al. Clinical utility of diffusion-weighted magnetic resonance imaging in the assessment of ischemic stroke. Ann Neurol 1997;41:574–80 - PubMed
-
- Shiga Y, Miyazawa K, Sato S, et al. Diffusion-weighted MRI abnormalities as an early diagnostic marker for Creutzfeldt-Jakob disease. Neurology 2004;63:443–49 - PubMed
-
- Romano A, Bozzao A, Bonamini M, et al. Diffusion-weighted MR imaging: clinical applications in neuroradiology. Radiol Med (Torino)2003;106:521–48 - PubMed
Publication types
MeSH terms
LinkOut - more resources
Full Text Sources
Medical