. 2008 Feb;146(2):737-47.
doi: 10.1104/pp.107.110924. Epub 2007 Dec 7.

The contribution of photosynthesis to the red light response of stomatal conductance

Affiliations

The contribution of photosynthesis to the red light response of stomatal conductance

Irene Baroli et al. Plant Physiol. 2008 Feb.

Abstract

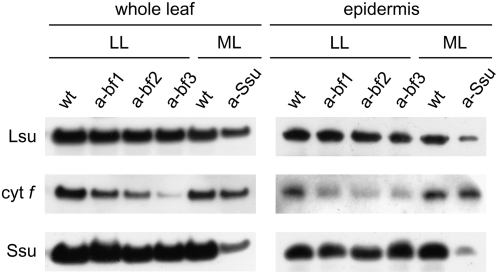
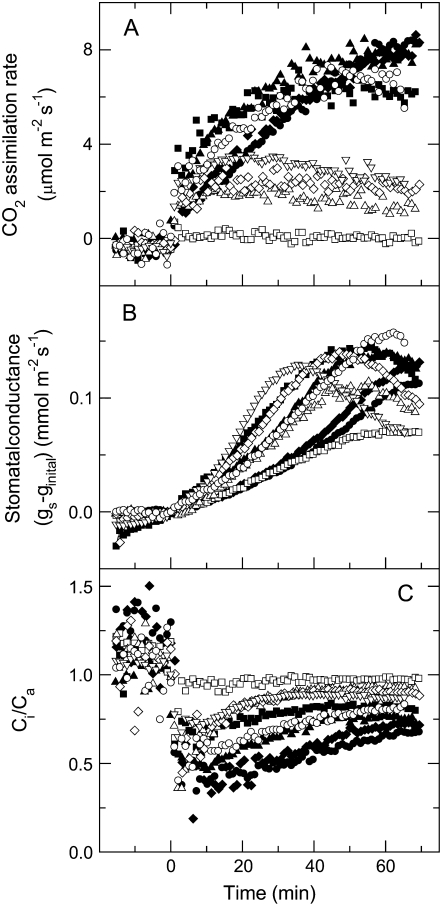
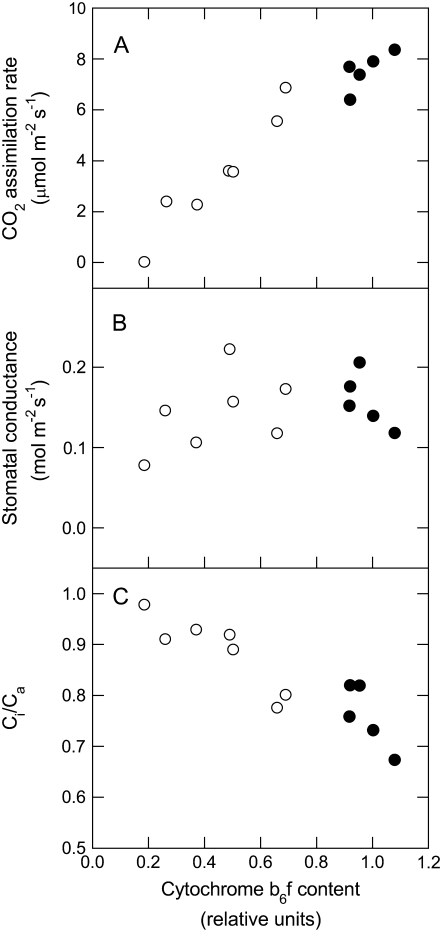
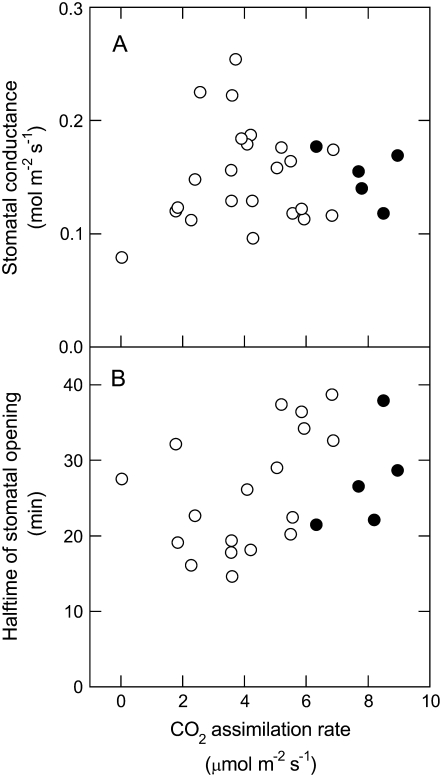
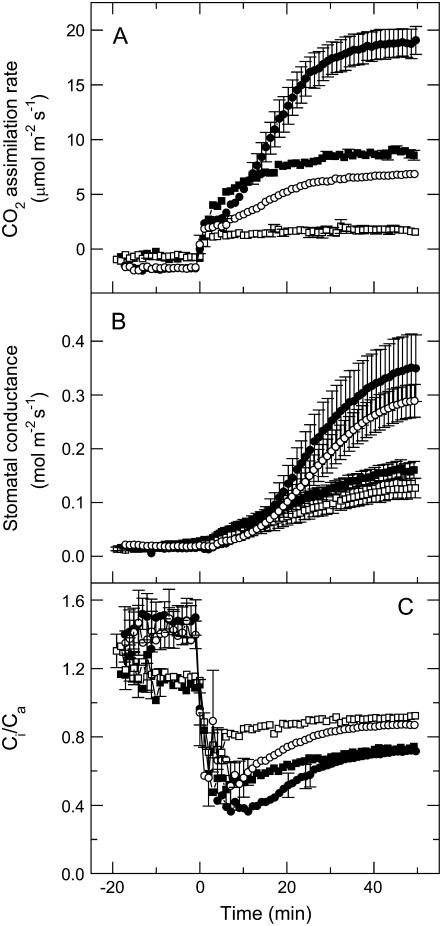
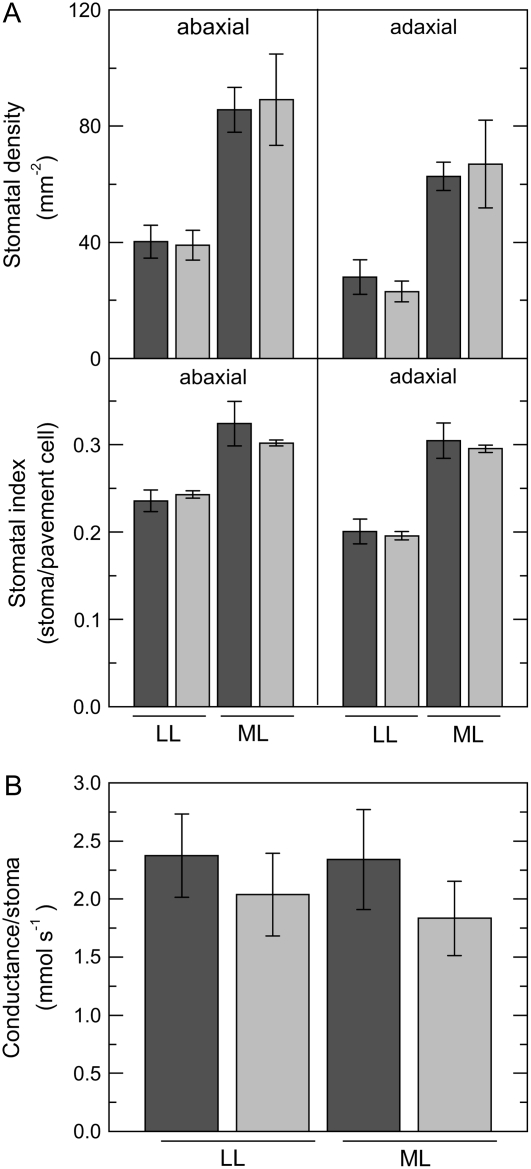
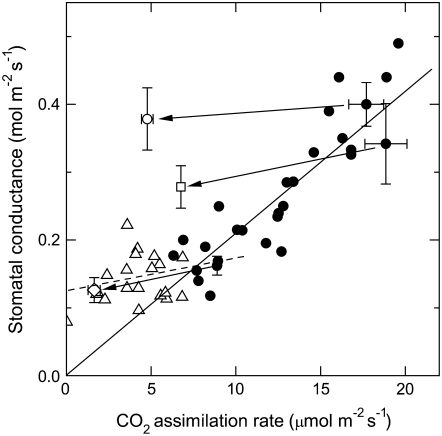
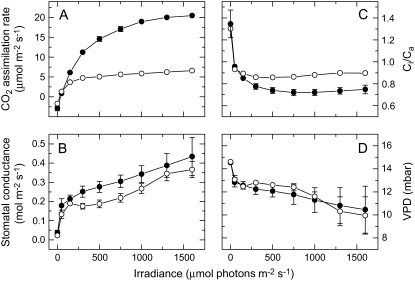
To determine the contribution of photosynthesis on stomatal conductance, we contrasted the stomatal red light response of wild-type tobacco (Nicotiana tabacum 'W38') with that of plants impaired in photosynthesis by antisense reductions in the content of either cytochrome b(6)f complex (anti-b/f plants) or Rubisco (anti-SSU plants). Both transgenic genotypes showed a lowered content of the antisense target proteins in guard cells as well as in the mesophyll. In the anti-b/f plants, CO(2) assimilation rates were proportional to leaf cytochrome b(6)f content, but there was little effect on stomatal conductance and the rate of stomatal opening. To compare the relationship between photosynthesis and stomatal conductance, wild-type plants and anti-SSU plants were grown at 30 and 300 micromol photon m(-2) s(-1) irradiance (low light and medium light [ML], respectively). Growth in ML increased CO(2) assimilation rates and stomatal conductance in both genotypes. Despite the significantly lower CO(2) assimilation rate in the anti-SSU plants, the differences in stomatal conductance between the genotypes were nonsignificant at either growth irradiance. Irrespective of plant genotype, stomatal density in the two leaf surfaces was 2-fold higher in ML-grown plants than in low-light-grown plants and conductance normalized to stomatal density was unaffected by growth irradiance. We conclude that the red light response of stomatal conductance is independent of the concurrent photosynthetic rate of the guard cells or of that of the underlying mesophyll. Furthermore, we suggest that the correlation of photosynthetic capacity and stomatal conductance observed under different light environments is caused by signals largely independent of photosynthesis.


Figures

Figure 1.
Figure 1.
Cytochrome b6f and Rubisco content in leaf and epidermis of wild-type and transgenic tobacco plants determined by immunoblotting. Total protein extracts of leaf discs and epidermal fragments are compared for content of cytochrome f (cyt f in the image) and the large subunit and SSU of Rubisco (Lsu and Ssu in the image, respectively). Plants were grown under LL or ML intensity for comparison of wild-type with anti-b/f and anti-SSU leaves, respectively. Three different anti-b/f plants, labeled a-bf1, a-bf2, and a-bf3, and having CO2 assimilation rates that were 43%, 36%, and 17% of wild-type values, respectively, are shown as representatives of anti-b/f plants with low photosynthetic rates. For whole-leaf samples, gel lanes were loaded on an equal-leaf-area basis, and samples from ML-grown plants were diluted 5-fold relative to samples from LL-grown plants. Equal total protein amounts (20 μg) were loaded when comparing epidermal samples. wt, Wild-type plant; a-Ssu, anti-SSU plant.
Figure 2.
Figure 2.
A to C, Kinetics of CO2 assimilation rate (A), leaf conductance (B), and the ratio of intercellular to ambient CO2 (Ci/Ca; C) in wild-type plants (black symbols) and a range of anti-b/f plants with different cytochrome b6f contents (white symbols), during illumination of dark acclimated leaves at an irradiance of 1,000 μmol photons m−2 s−1 of red light. Symbols of different shape (white or black) represent measurements made on different plants. Light was turned on at time 0. Measurements were conducted at 362 μmol mol−1 CO2, a leaf temperature of 25°C, and a leaf chamber humidity of 19 mbar. Leaves were acclimated in the dark for a minimum of 20 min before the measurements. Stomatal conductance (gs) was normalized by subtracting the conductance values at time 0 (ginitial), which ranged between 0.006 and 0.035 mol m−2 s−1.
Figure 3.
Figure 3.
Leaf gas-exchange parameters as a function of cytochrome b6f complex content in wild-type (black circles) and anti-b/f (white circles) tobacco. A, CO2 assimilation rate. B, Stomatal conductance. C, The ratio of intercellular to ambient CO2 (Ci/Ca). Leaf cytochrome b6f complex content was determined from immunoblots such as the one shown in Figure 1 and is expressed as a fraction of the maximum wild-type value. Gas-exchange experiments were performed as described in Figure 2. Each point corresponds to a leaf from a different plant.
Figure 4.
Figure 4.
Relationship between maximal stomatal conductance and CO2 assimilation rate in wild-type and anti-b/f tobacco measured under red light. A, Stomatal conductance. B, Half-times of stomatal opening. Experimental conditions were the same as for Figure 2. Each point corresponds to a different plant. Black circles, wild-type plants; white circles, anti-b/f plants. Half-times were calculated as the time taken to reach half the maximal conductance from the time the light was turned on.
Figure 5.
Figure 5.
A to C, Kinetics of CO2 assimilation rate (A), leaf conductance (B), and the ratio of intercellular to ambient CO2 (Ci/Ca; C) in wild-type and anti-SSU plants with 10% to 15% of wild-type Rubisco during illumination of dark acclimated leaves at an irradiance of 1,000 μmol photons m−2 s−1 of red light. Plants were grown under an irradiance of 30 μmol photons m−2 s−1 (LL, squares) or 300 μmol photons m−2 s−1 (ML, circles). During gas-exchange measurements, light was turned on at time 0. Leaves were acclimated in the dark for a minimum of 20 min before the measurements. Experimental conditions were the same as for Figure 2. Data are the means of measurements on four different plants; error bars represent se and are not shown if smaller than the symbols. Black symbols, wild-type plants; white symbols, anti-SSU plants.
Figure 6.
Figure 6.
Number of stomata on the leaf surface of wild-type (dark gray bars) and anti-SSU (light gray bars) tobacco plants as a function of growth irradiance and stomatal conductance normalized by stomatal numbers. Plants were grown under an irradiance of 30 μmol photons m−2 s−1 (LL) or 300 μmol photons m−2 s−1 (ML). A, Stomatal density. B, Stomatal index. C, Stomatal conductance normalized by stomatal numbers. Data represent mean values ± se from four different plants.
Figure 7.
Figure 7.
Relationship between stomatal conductance and CO2 assimilation rate in wild-type and transgenic tobacco plants impaired in photosynthesis either by a decrease in electron transport rates (anti-b/f plants) or in Rubisco function (anti-SSU plants). Plants were grown under elevated CO2 in environmentally controlled chambers and conductance and photosynthesis measurements were performed under ambient CO2. Black circles, wild type; white triangles, anti-b/f plants; white diamond, mean ± se (n = 4) from LL-grown anti-SSU plants; white square, mean ± se (n = 4) of ML-grown anti-SSU plants; white circle, mean ± se (n = 5) from ML-grown anti-SSU plants assayed in red-blue light (von Caemmerer et al., 2004). Arrows link data from anti-SSU plants with the mean ± se of four to five wild-type plants grown and assayed under identical conditions at the same time. The solid and dashed lines represent the linear regression fit of all wild-type data (y = 0.0217 (±0.00069) × x, R = 0.90), and LL-grown wild-type and anti-b/f data as shown in Figure 4A (y = 0.1209 (±0.0159) + 0.00514 (±0.0 29) × x, R = 0.34), respectively. Each data point not showing error bars corresponds to an individual plant. Error bars represent se.
Figure 8.
Figure 8.
A to D, Red light response of CO2 assimilation rate (A), leaf conductance (B), the ratio of intercellular to ambient CO2 (Ci/Ca; C), and leaf-to-air vapor pressure difference (D) in wild-type and anti-SSU plants. Measurements were conducted at 362 μbar CO2, a leaf temperature of 25°C, and an initial leaf chamber humidity of 19 mbar. Leaves from ML-grown plants were acclimated in the dark for a minimum of 20 min before the red light was turned on and light intensity increased stepwise at 30-min intervals. Data are the means of measurements on three different plants; error bars represent se and are not shown if smaller than the symbols. Black circles, wild-type plants; white circles, anti-SSU plants.

References

    1. Ball J, Woodrow I, Berry J (1987) A model predicting stomatal conductance and its contribution to the control of photosynthesis under different environmental conditions. In J Biggins, ed, Progress in Photosynthesis Research, Vol IV. Martinus Nijhoff, Leiden, The Netherlands, pp 221–224
    1. Bergmann D (2006) Stomatal development: from neighbourly to global communication. Curr Opin Plant Biol 9 478–483 - PubMed
    1. Bruce B, Malkin R (1991) Biosynthesis of the chloroplast b6f complex: studies in a photosynthetic mutant of Lemna. Plant Cell 3 203–212 - PMC - PubMed
    1. Buckley TN, Mott KA, Farquhar GD (2003) A hydromechanical and biochemical model of stomatal conductance. Plant Cell Environ 26 1767–1785
    1. Cardon ZG, Berry J (1992) Effects of O2 and CO2 concentration on the steady-state fluorescence yield of single guard cell pairs in intact leaf discs of Tradescantia albiflora: evidence for Rubisco-mediated CO2 fixation and photorespiration in guard cells. Plant Physiol 99 1238–1244 - PMC - PubMed

Publication types

LinkOut - more resources