. 2008 Feb;146(2):682-93.
doi: 10.1104/pp.107.108761. Epub 2007 Dec 7.

Characterization of the interaction of a novel Stagonospora nodorum host-selective toxin with a wheat susceptibility gene

Affiliations

Characterization of the interaction of a novel Stagonospora nodorum host-selective toxin with a wheat susceptibility gene

Timothy L Friesen et al. Plant Physiol. 2008 Feb.

Abstract

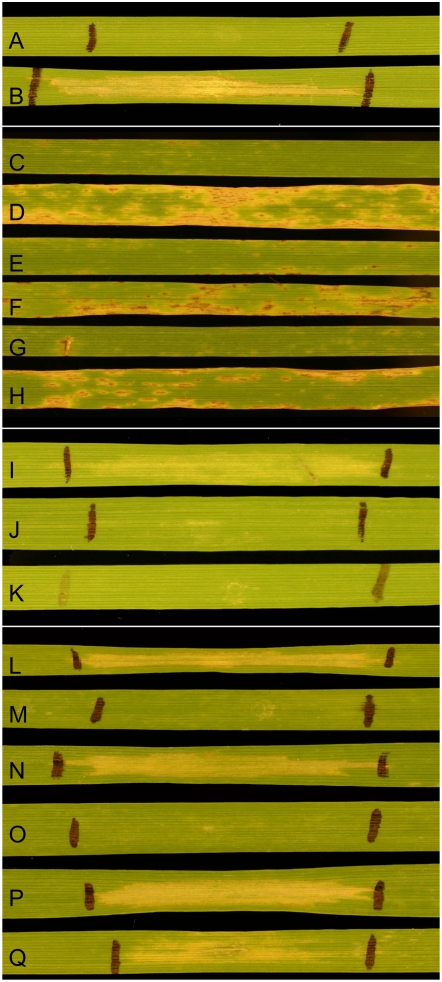
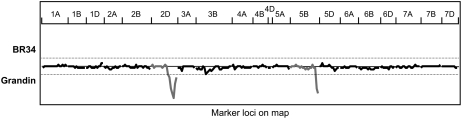
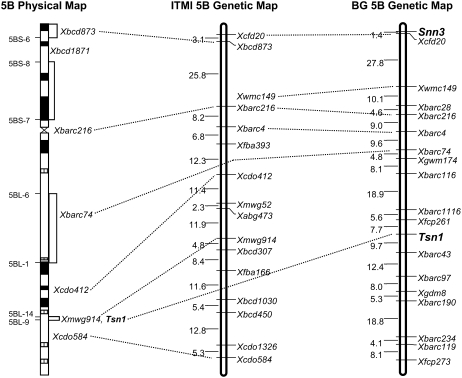
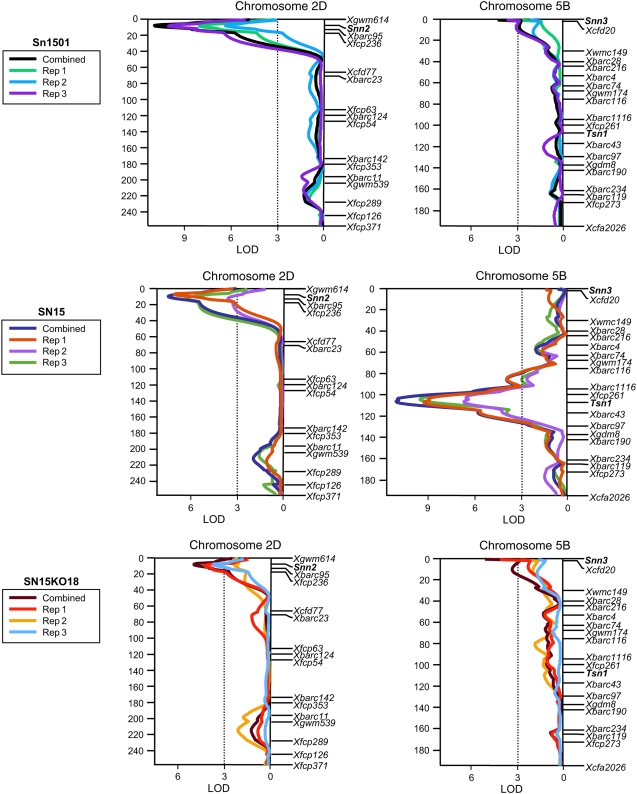
Recent work suggests that the Stagonospora nodorum-wheat pathosystem is controlled by host-selective toxins (HSTs; SnToxA, SnTox1, and SnTox2) that interact directly or indirectly with dominant host genes (Tsn1, Snn1, and Snn2) to induce disease. Here we describe and characterize a novel HST designated SnTox3, and the corresponding wheat sensitivity/susceptibility gene identified on chromosome arm 5BS, which we designated as Snn3. SnTox3 is a proteinaceous necrosis-inducing toxin between 10 and 30 kD in size. The S. nodorum isolates Sn1501 (SnToxA-, SnTox2+, and SnTox3+), SN15 (SnToxA+, SnTox2+, and SnTox3+), and SN15KO18, a strain of SN15 with a disrupted form of SnToxA, were evaluated on a population of wheat recombinant inbred lines. A compatible Snn3-SnTox3 interaction played a significant role in the development of disease caused by isolates Sn1501 and SN15KO18, with Snn2 being epistatic to Snn3. Snn3 was not significantly associated with disease caused by SN15 presumably due to the major effects observed for Snn2 and Tsn1, which were largely additive. This work introduces a fourth HST produced by S. nodorum and builds on the notion that the S. nodorum-wheat pathosystem is largely based on multiple host-toxin interactions that follow an inverse gene-for-gene scenario.


Figures

Figure 1.
Figure 1.
Infiltration and inoculation reactions. A and B, BR34 (A) and ‘Grandin’ (B) infiltrated with culture filtrates of Sn1501 containing both SnTox2 and SnTox3. C and D, BR34 (C) and ‘Grandin’ (D) inoculated with SN15 (SnToxA+, SnTox2+, and SnTox3+). E and F, BR34 (E) and ‘Grandin’ (F) inoculated with SN15KO18 (SnToxA−, SnTox2+, and SnTox3+). G and H, BR34 (G) and ‘Grandin’ (H) inoculated with Sn1501 (SnToxA−, SnTox2+, and SnTox3+). The SnTox3-sensitive differential line BG220 was infiltrated with fractions containing SnTox3 treated with 1× MOPS buffer alone (I) and pronase in 1× MOPS buffer (J) with pronase alone in 1× MOPS buffer (K) being used as a control. Size estimation was done using Centricon MWCO filters and infiltrating the filtrate and concentrate into the SnTox3-sensitive differential line BG220. Line BG220 was sensitive to the filtrate (P) and concentrate (Q) of the 30,000 MWCO filter as well as the concentrate of the 10,000 (N) and the 3,000 (L) MWCO filter; however, the filtrate of the 10,000 (O) and 3,000 (M) MWCO filter showed no necrosis when infiltrated into the SnTox3-sensitive BG220 differential line.
Figure 2.
Figure 2.
SLR analysis of reactions to culture filtrates of S. nodorum isolate Sn1501 and 354 markers mapped in the BG population. Marker loci are represented on the x axis and chromosomes are indicated in horizontal positions across the top. The dotted lines represent the significance threshold of P < 0.001. Peaks below the x axis indicate toxin sensitivity is contributed by ‘Grandin’. Regression lines for chromosomes 2D and 5B, which harbor Snn2 and Snn3, respectively, are shown in gray.
Figure 3.
Figure 3.
Genetic and physical maps of wheat chromosome 5B. On the deletion-based physical map (left; Gill et al., 1996; Sourdille et al., 2004), positions of deletion breakpoint are shown along the left of the chromosome and bin-mapped markers are shown along the right. Black and hatched regions indicate locations of chromosome c bands. Genetic maps of chromosome 5B generated in the ITMI population (middle; http://wheat.pw.usda.gov/ggpages/map_summary.html) and the BG population (right; Liu et al., 2005) have centiMorgan distances indicated along the left and markers along the right.
Figure 4.
Figure 4.
Polyacrylamide gel electrophoresis of fragments amplified with the SSR primer set CFD20, which correspond to the marker Xcfd20 on chromosome arm 5BS. Lanes are annotated across the top, and the Xcfd20-5B fragment and a 500-bp marker are indicated by arrows along the right. The presence of the Xcfd20 fragment in T. dicoccoides accession PI478742 and the LDN-DIC 5B chromosome substitution line indicates that the fragment resides on chromosome 5B. The same fragment was polymorphic between W-7984 and Opata 85, and between BR34 and ‘Grandin’, and therefore was mapped in the ITMI and BG populations, respectively, to the short arm of 5B (Fig. 3).
Figure 5.
Figure 5.
Interval regression analysis of chromosomes 2D and 5B for reaction to SNLB produced by S. nodorum isolates Sn1501, SN15, and SN15KO18. Analyses of replicates 1, 2, and 3 and the combined means for each isolate are indicated by different colored lines as depicted in the boxes to the left of the maps for each isolate. A centiMorgan scale is indicated to the left of the maps, and markers are shown in their relative positions along the right. An LOD scale is shown along the x axis, and the critical LOD threshold of 3.0 is indicated by the dotted line.

References

    1. Aguilar V, Stamp P, Winzeler M, Winzeler H, Schachermayr G, Keller B, Zanetti S, Messmer MM (2005) Inheritance of field resistance to Stagonospora nodorum leaf and glume blotch and correlations with other morphological traits in hexaploid wheat (Triticum aestivum L.). Theor Appl Genet 111 325–336 - PubMed
    1. Ciuffetti LM, Tuori RP (1999) Advances in the characterization of the Pyrenophora tritici-repentis-wheat interaction. Phytopathology 89 444–449 - PubMed
    1. Ciuffetti LM, Tuori RP, Gaventa JM (1997) A single gene encodes a selective toxin causal to the development of tan spot of wheat. Plant Cell 9 135–144 - PMC - PubMed
    1. Czembor PC, Arseniuk E, Czaplicki A, Song QJ, Cregan PB, Ueng PP (2003) QTL mapping of partial resistance in winter wheat to Stagonospora nodorum blotch. Genome 46 546–554 - PubMed
    1. Endo TR, Gill BS (1996) The deletion stocks of common wheat. J Hered 87 295–307

Publication types

LinkOut - more resources