

Foxg1 haploinsufficiency reduces the population of cortical intermediate progenitor cells: effect of increased p21 expression
- PMID: 18065723
- PMCID: PMC2790389
- DOI: 10.1093/cercor/bhm209
Foxg1 haploinsufficiency reduces the population of cortical intermediate progenitor cells: effect of increased p21 expression
Abstract
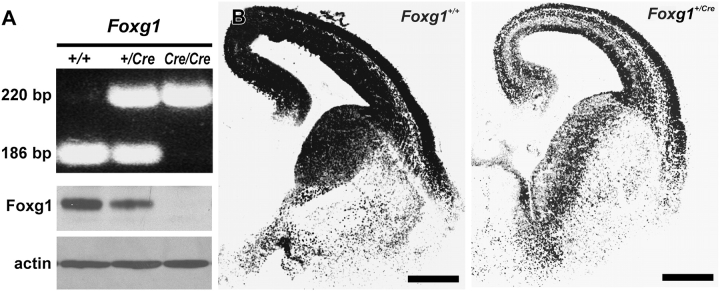
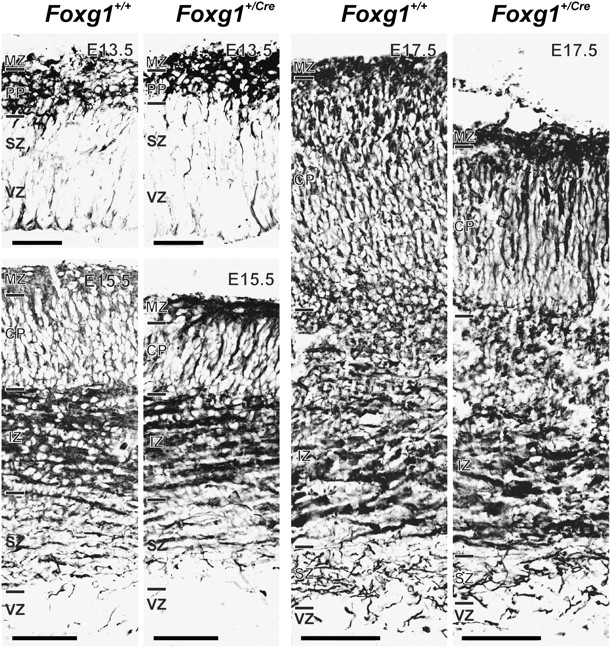
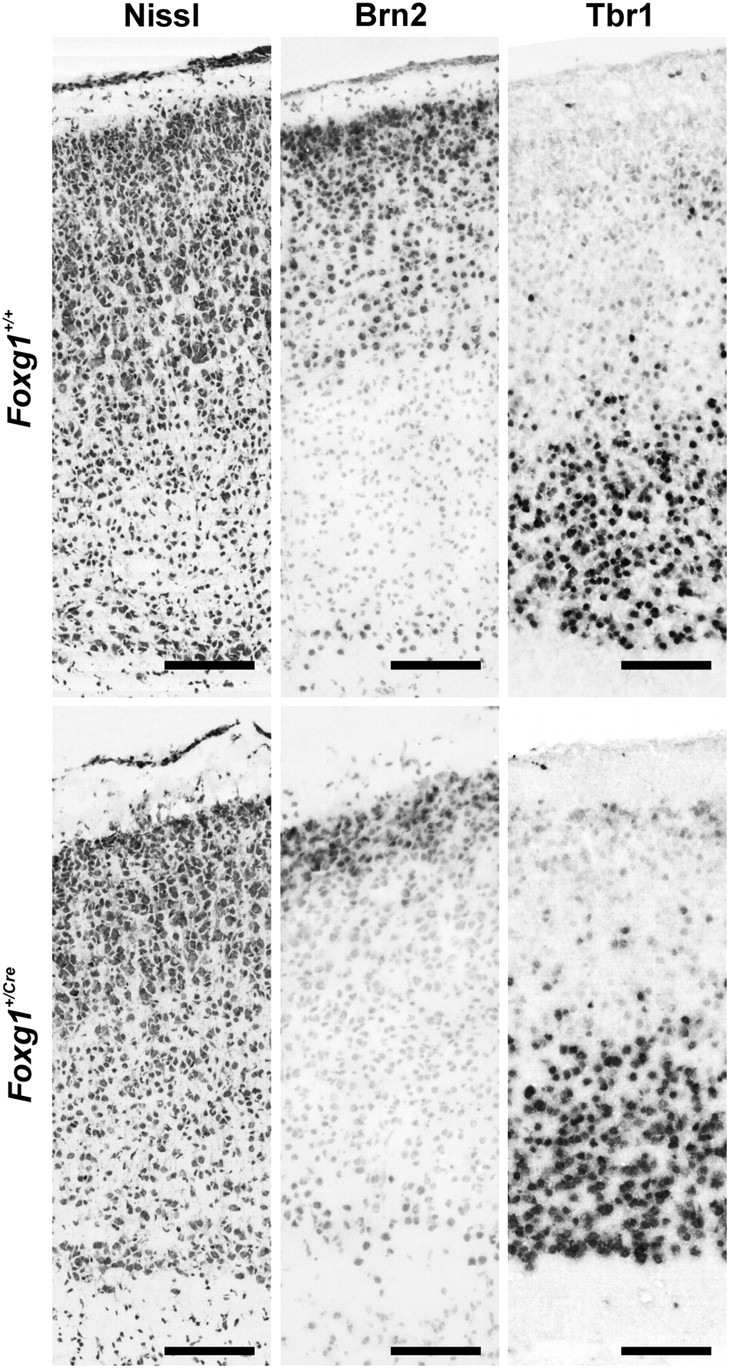
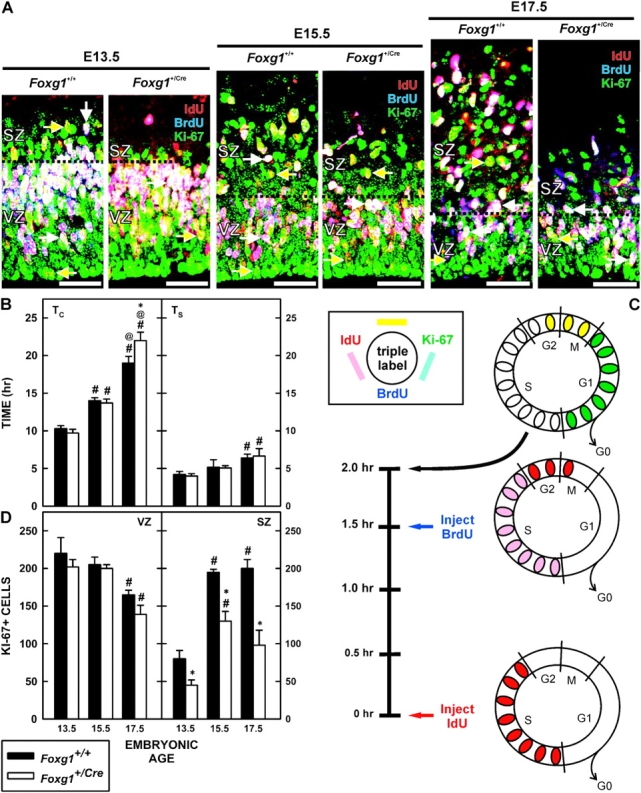
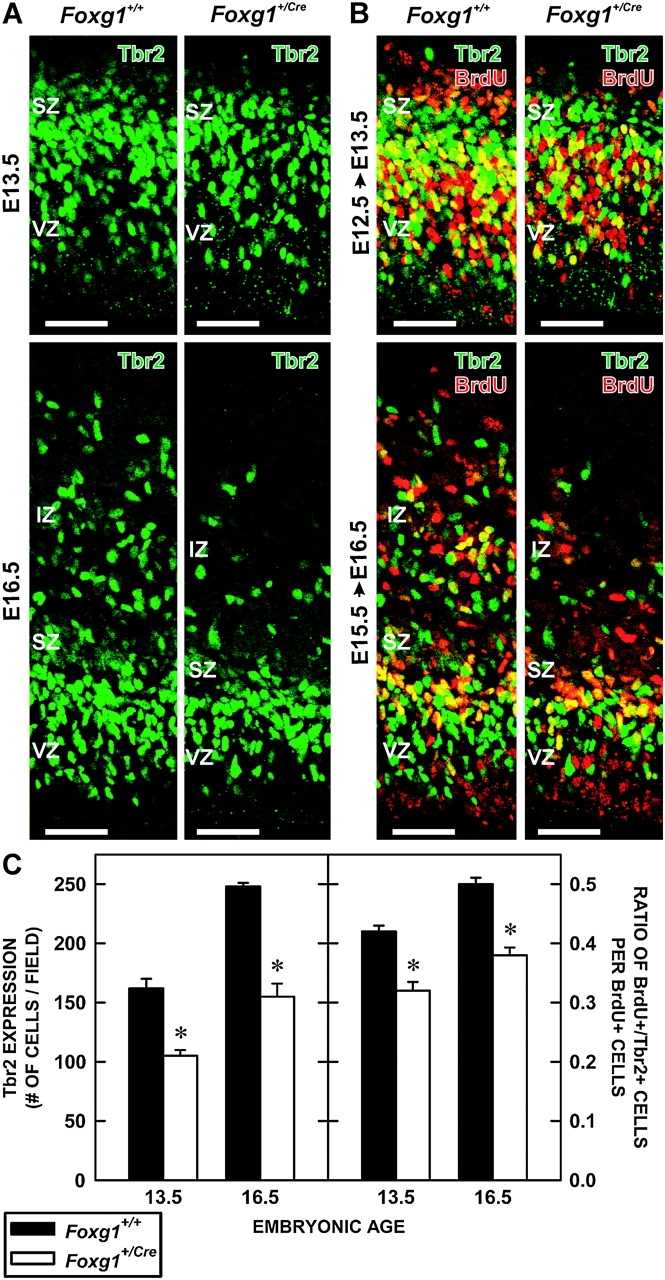
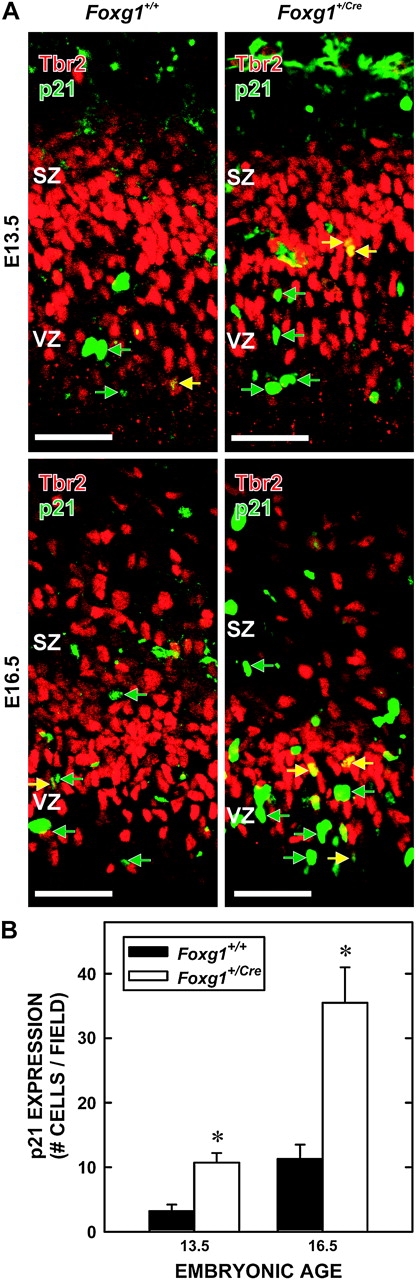
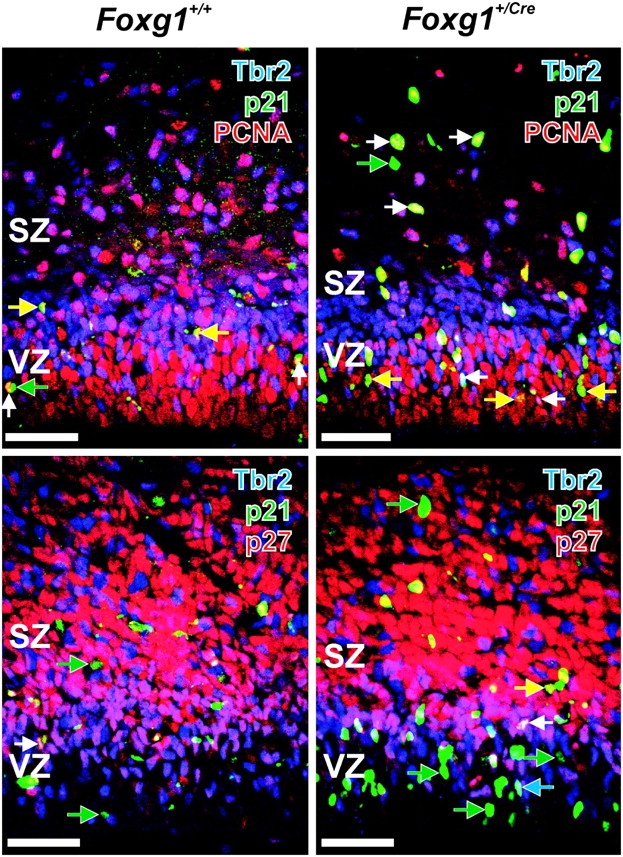
Foxg1 is a transcription factor that is critical for forebrain development. Foxg1(+/Cre) mice were used to test the hypotheses 1) that the subventricular zone (SZ) generates supragranular neurons, 2) that Foxg1-regulated activities define the output from the SZ, and 3) that Foxg1 is involved in the suppression of p21-initiated cell-cycle exit. Foxg1(+/Cre) mice have thinner neocortices than wild-type controls, specifically in the supragranular layers, as detected by Brn2 immunostaining. Cell proliferation in the ventricular zone (VZ) and SZ was examined to investigate the reduction in upper layer neurons. The number of cycling VZ cells was similar in Foxg1(+/+) and Foxg1(+/Cre) brains. Interestingly, cell proliferation in the SZ and intermediate progenitor cell (IPC) production (noted by Tbr2-immunostaining) was reduced in Foxg1(+/Cre) brains. These decreases coincided with increased expression of the cell-cycle inhibitor p21 in the VZ and SZ. Furthermore, colocalization of p21 with markers of cell proliferation and IPCs indicated that p21 was temporally expressed to influence the proliferative fate of IPCs. Thus, the present data are consistent with the above hypotheses, particularly, that during corticogenesis, Foxg1-regulated activities enable the expansion of the IPC population likely through suppression of p21-dependent cell-cycle exit.
Figures
Similar articles
-
Foxg1 promotes olfactory neurogenesis by antagonizing Gdf11.Development. 2009 May;136(9):1453-64. doi: 10.1242/dev.034967. Epub 2009 Mar 18. Development. 2009. PMID: 19297409 Free PMC article.
-
Generation of Cajal-Retzius neurons in mouse forebrain is regulated by transforming growth factor beta-Fox signaling pathways.Dev Biol. 2008 Jan 1;313(1):35-46. doi: 10.1016/j.ydbio.2007.09.036. Epub 2007 Nov 19. Dev Biol. 2008. PMID: 18005957 Free PMC article.
-
FoxG1 haploinsufficiency results in impaired neurogenesis in the postnatal hippocampus and contextual memory deficits.Hippocampus. 2006;16(10):875-90. doi: 10.1002/hipo.20218. Hippocampus. 2006. PMID: 16941454
-
Transforming growth factor beta 1 promotes cell cycle exit through the cyclin-dependent kinase inhibitor p21 in the developing cerebral cortex.J Neurosci. 2005 Sep 21;25(38):8627-36. doi: 10.1523/JNEUROSCI.1876-05.2005. J Neurosci. 2005. PMID: 16177030 Free PMC article.
-
Role of intermediate progenitor cells in cerebral cortex development.Dev Neurosci. 2008;30(1-3):24-32. doi: 10.1159/000109848. Dev Neurosci. 2008. PMID: 18075251 Review.
Cited by
-
Sall1 regulates cortical neurogenesis and laminar fate specification in mice: implications for neural abnormalities in Townes-Brocks syndrome.Dis Model Mech. 2012 May;5(3):351-65. doi: 10.1242/dmm.002873. Epub 2011 Dec 22. Dis Model Mech. 2012. PMID: 22228756 Free PMC article.
-
Rett and Rett-related disorders: Common mechanisms for shared symptoms?Exp Biol Med (Maywood). 2023 Nov;248(22):2095-2108. doi: 10.1177/15353702231209419. Epub 2023 Dec 6. Exp Biol Med (Maywood). 2023. PMID: 38057990 Free PMC article. Review.
-
Molecular Pathways Underlying Projection Neuron Production and Migration during Cerebral Cortical Development.Front Neurosci. 2015 Dec 17;9:447. doi: 10.3389/fnins.2015.00447. eCollection 2015. Front Neurosci. 2015. PMID: 26733777 Free PMC article. Review.
-
Technical challenges and limitations of current mouse models of ovarian cancer.J Ovarian Res. 2012 Nov 29;5(1):39. doi: 10.1186/1757-2215-5-39. J Ovarian Res. 2012. PMID: 23190474 Free PMC article.
-
ATP-Dependent Chromatin Remodeling During Cortical Neurogenesis.Front Neurosci. 2018 Apr 9;12:226. doi: 10.3389/fnins.2018.00226. eCollection 2018. Front Neurosci. 2018. PMID: 29686607 Free PMC article. Review.
References
-
- Al-Ghoul WM, Miller MW. Transient expression of Alz-50-immunoreactivity in developing rat neocortex: a marker for naturally occurring neuronal death? Brain Res. 1989;481:361–367. - PubMed
-
- Angevine JB, Jr, Sidman RL. Autoradiographic study of cell migration during histiogenesis of cerebral cortex in the mouse. Nature. 1961;192:766–768. - PubMed
-
- Brückner G, Marěs V, Biesold D. Neurogenesis in the visual system of the rat. An autoradiographic investigation. J Comp Neurol. 1976;166:245–255. - PubMed
Publication types
MeSH terms
Substances
Grants and funding
LinkOut - more resources
Full Text Sources
Medical
Molecular Biology Databases
