. 2008 May;124(1):89-101.
doi: 10.1111/j.1365-2567.2007.02743.x. Epub 2007 Dec 7.

Apoptotic cells induce dendritic cell-mediated suppression via interferon-gamma-induced IDO

Affiliations

Apoptotic cells induce dendritic cell-mediated suppression via interferon-gamma-induced IDO

Charlotte A Williams et al. Immunology. 2008 May.

Abstract

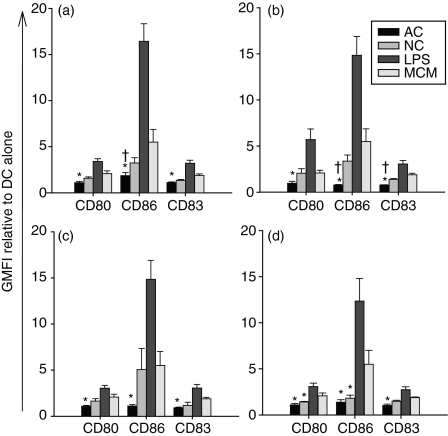
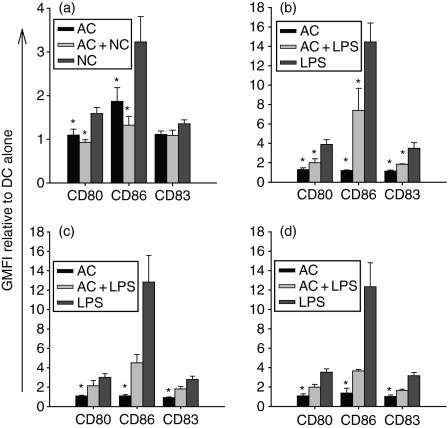
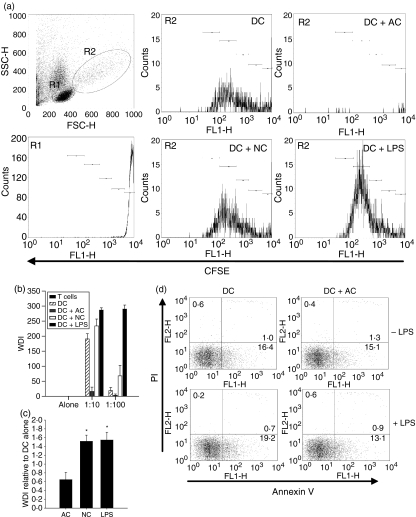
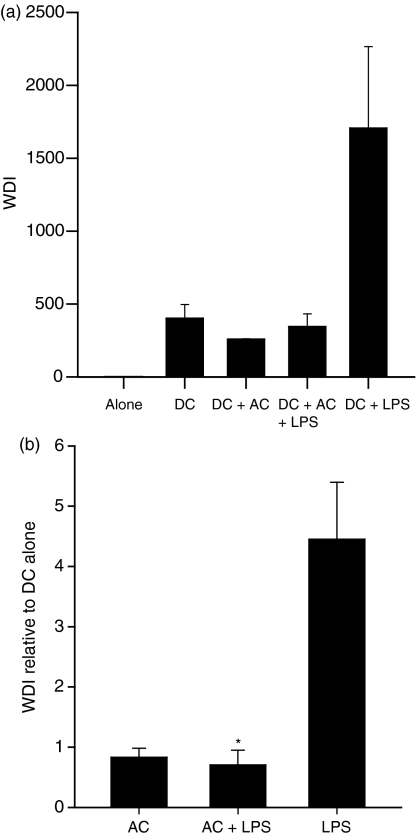
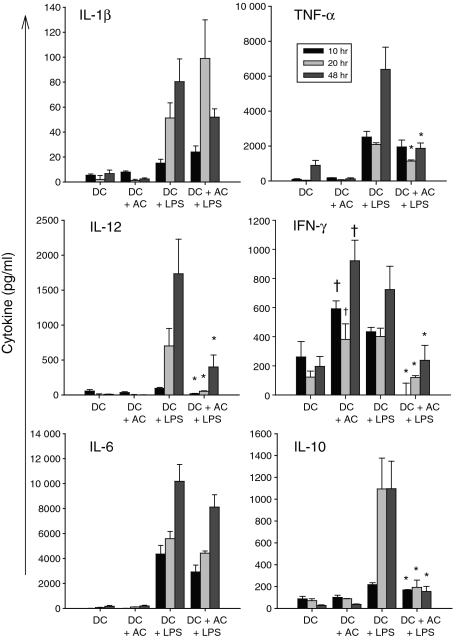
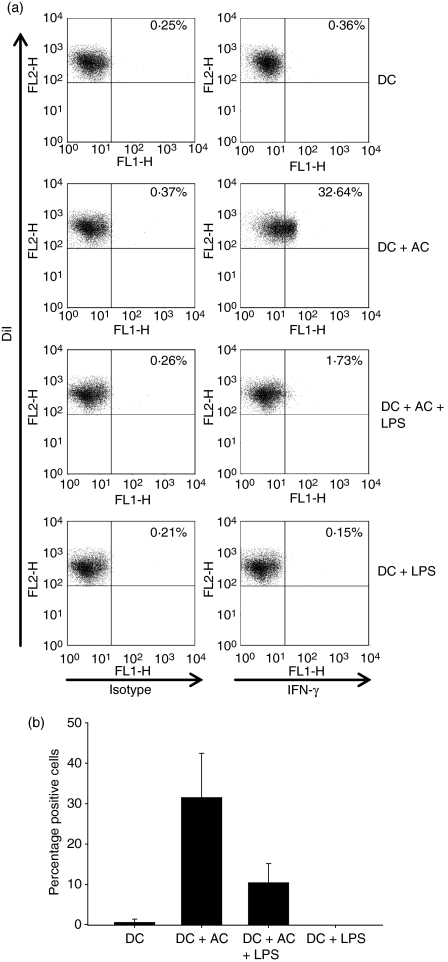
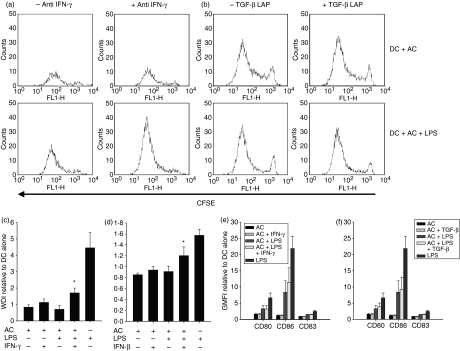
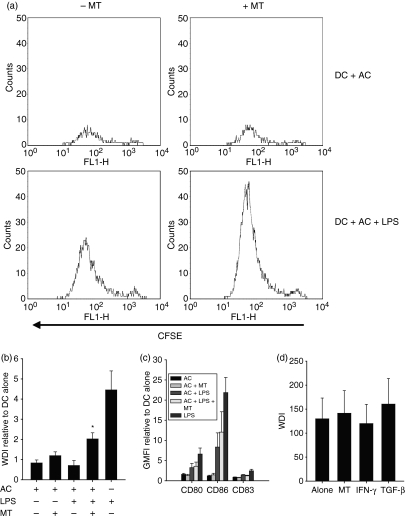
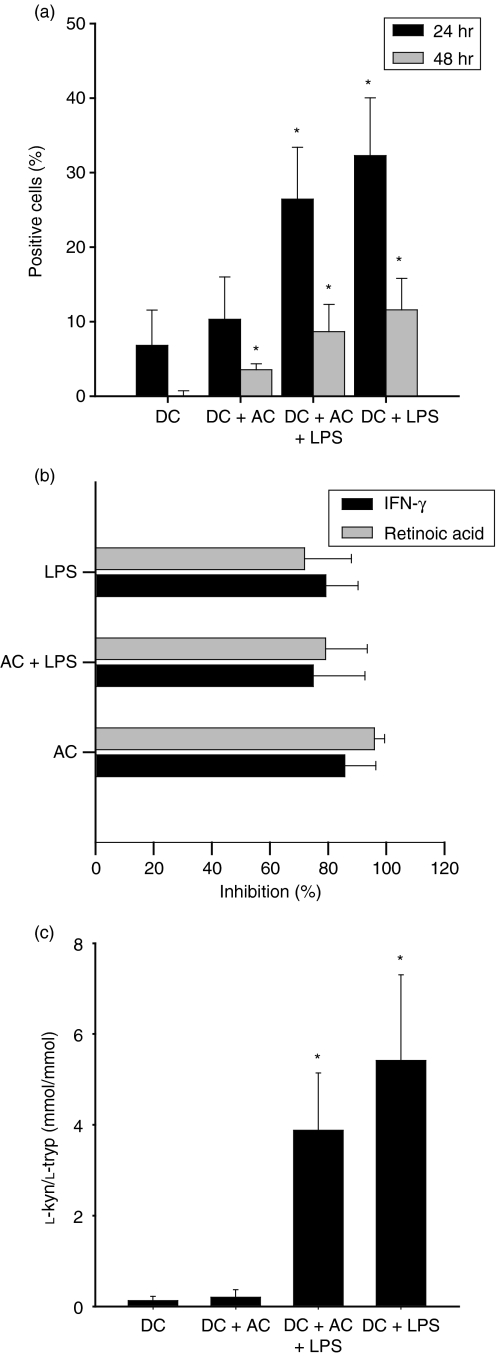
Dendritic cells (DC) are sensitive to their local environment and are affected by proximal cell death. This study investigated the modulatory effect of cell death on DC function. Monocyte-derived DC exposed to apoptotic Jurkat or primary T cells failed to induce phenotypic maturation of the DC and were unable to support CD4+ allogeneic T-cell proliferation compared with DC exposed to lipopolysaccharide (LPS) or necrotic cells. Apoptotic cells coincubated with LPS- or necrotic cell-induced mature DC significantly suppressed CD80, CD86 and CD83 and attenuated LPS-induced CD4+ T-cell proliferation. Reduced levels of interleukin-12 (IL-12), IL-10, IL-6, tumour necrosis factor-alpha and interferon-gamma (IFN-gamma) were found to be concomitant with the suppressive activity of apoptotic cells upon DC. Furthermore, intracellular staining confirmed IFN-gamma expression by DC in association with apoptotic environments. The specific generation of IFN-gamma by DC within apoptotic environments is suggestive of an anti-inflammatory role by the induction of indoleamine 2,3-dioxygenase (IDO). Both neutralization of IFN-gamma and IDO blockade demonstrated a role for IFN-gamma and IDO in the suppression of CD4+ T cells. Moreover, we demonstrate that IDO expression within the DC was found to be IFN-gamma-dependent. Blocking transforming growth factor-beta (TGF-beta) also produced a partial release in T-cell proliferation. Our study strongly suggests that apoptosis-induced DC suppression is not an immunological null event and two prime mediators underpinning these functional effects are IFN-gamma-induced IDO and TGF-beta.


Figures

Figure 1
Figure 1
Apoptotic cells (AC) do not induce phenotypic maturation of dendritic cells (DC). The DC were cultured with lipopolysaccharide (LPS; 5 μg/ml) or AC or necrotic cells (NC) at a 1 : 5 ratio for 48 hr before staining for CD80, CD86 and CD83. The DC cultured with Fas- (a) or TNF-α- (b) induced AC Jurkat cells or Fas-induced AC primary autologous (c) or allogeneic (d) T cells do not upregulate CD80, CD86 and CD83, displaying a phenotype similar to DC cultured alone. DC exposed to NC Jurkat cells and primary autologous and allogeneic T cells demonstrate increases in CD80, CD86 and CD83. Changes in surface expression markers were detected by flow cytometry and are represented as the geometric mean fluorescence intensity (GMFI) relative to DC alone. Bars represent means of four or more independent experiments ± SEM. *P ≤ 0·05 and †P ≤ 0·05 when compared with DC + monocyte-conditioned medium (MCM) and DC + NC respectively.
Figure 2
Figure 2
Apoptotic cells (AC) inhibit phenotypic maturation of dendritic cells (DC). The DC were cultured with AC simultaneously with necrotic cells (NC) or lipopolysaccharide (LPS) for 48 hr before staining for surface expression of CD80, CD86 and CD83. Addition of AC Jurkat cells to NC- (a) or LPS- (b) stimulated mature DC (mDC) results in reduced expression of CD80, CD86 and CD83 when compared with controls. Apoptotic autologous (c) or allogeneic (d) primary T cells reduced LPS-stimulated mDC expression of CD80, CD86 and CD83. Surface expression of markers was determined by flow cytometry and is represented as geometric mean fluorescence intensity (GMFI) relative to DC alone. Values expressed are means of three or more independent experiments ± SEM. *P ≤ 0·05 DC + NC or DC + LPS.
Figure 3
Figure 3
Apoptotic cell (AC) conditioned immature DC (iDC) do not support CD4+ T-cell proliferation. Dendritic cells (DC) were cultured with either AC, necrotic cells (NC) or lipopolysaccharide (LPS) for 48 hr before incorporation into T-cell proliferation assays. (a) and (b) show representative results including CFSE plots of R1 and R2 gates of T-cell cultures (a) and DC : T-cell ratios of 1 : 10 and 1 : 100 (b). (c) shows mean data relative to DC showing that AC suppress iDC to support T-cell proliferation. Proliferation is represented as the weighted division index (WDI) or the WDI relative to DC alone. T-cell apoptosis was quantified at day 5 using flow cytometry and an annexin V and propidium iodide viability assay (d). The percentage of positive cells for the given quadrant are shown. Bars represent the mean of triplicate wells for the representative assay or of four independent experiments ± SEM for collated data. Histograms and dot plots represent one independent experiment of three. *P ≤ 0·001 when compared with DC + AC.
Figure 4
Figure 4
Apoptotic cells (AC) suppress lipopolysaccharide (LPS)-stimulated dendritic cell (DC)-induced CD4+ T-cell proliferation. The DC were cultured with AC simultaneously with LPS before incorporation into T-cell proliferation assay at a 1 : 10 ratio. T-cell proliferation was quantified at day 5 by flow cytometry and CFSE dilution analysis. (a) shows one representative assay and (b) shows mean data expressed relative to DC alone. Proliferation is represented as the weighted division index (WDI) or the WDI relative to DC alone. Bars represent the mean of triplicate wells for the representative assay or of four independent experiments ± SEM for collated data. *P ≤ 0·001 when compared with DC + LPS.
Figure 5
Figure 5
Apoptotic cells (AC) induce interferon-γ (IFN-γ) production by dendritic cells (DC) and suppress lipopolysaccharide (LPS)-stimulated DC cytokine secretion. DC were cultured alone, with LPS or with AC in the presence or absence of LPS for up to 48 hr. Supernatants were analysed by cytokine array, the concentration of which are shown as pg/ml. AC specifically induce IFN-γ production by DC and suppress LPS-induced cytokine production of interleukin-12 (IL-12), IL-6, IL-10, tumour necrosis factor-α (TNF-α) and IFN-γ. Data represents the mean of quadruplicate spots from three or more independent experiments ± SEM. *P ≤ 0·05 and †P ≤ 0·01 when compared with DC + LPS or DC alone.
Figure 6
Figure 6
Apoptotic cells (AC) induce dendritic cell (DC) production of interferon-γ (IFN-γ) at 8 hr. The DC were cultured with AC at a 1 : 5 ratio with or without lipopolysaccharide (LPS) for up to 48 hr. Intracellular IFN-γ production was determined in DiI+ DC by the addition of Brefeldin A (10 μg/ml) 4 hr before staining. At 8 hr, IFN-γ was produced by DC in response to AC maximally observed in the absence of LPS (a) as determined by flow cytometric analysis. Values represent the percentage of isotype or IFN-γ+ DiI+ cells. (b) shows the mean percentage of IFN-γ+ DiI+ DC of three independent experiments ± SD.
Figure 7
Figure 7
Interferon-γ (IFN-γ) and transforming growth factor-β (TGF-β) modulate mature dendritic cell (mDC)-induced T-cell proliferation. DC were cultured with apoptotic cells (AC) at a 1 : 5 ratio, in the presence or absence of lipopolysaccharide (LPS), interferon-γ (IFN-γ) neutralizing antibody or TGF-β LAP for 48 hr, analysed phenotypically or incorporated into a T-cell proliferation assay. AC suppression of mDC-induced CD4+ T-cell proliferation was partially released by neutralizing IFN-γ (a, representative plot and c) and by blocking TGF-β (b, representative plots and d). Representative CFSE plots are of the proliferating blast (R2 region) cells (region gates and a representative R1 CFSE plot are shown in Fig. 3a). Representative T-cell proliferation was determined by flow cytometry and CFSE dilution analysis and is represented by the weighted division index (WDI) relative to DC alone. The effects of blockade of IFN-γ and TGF-β were independent of effects upon DC phenotype (e, f). Changes in expression of surface markers were determined by flow cytometry and are represented as GMFI relative to DC alone. Bars represent the means of three or more independent experiments ± SEM for collated data. *P ≤ 0·05 when compared with DC + AC + LPS.
Figure 8
Figure 8
IDO modulates mature dendritic cell (mDC)-induced T-cell proliferation. Dendritic cells (DC) were cultured for 48 hr with apoptotic cells (AC) at a ratio of 1 : 5 in the presence or absence of LPS or 1-methyl tryptophan before staining or incorporation into a T-cell proliferation assay. AC suppression of lipopolysaccharide (LPS) -stimulated DC CD4+ T-cell proliferation is partially released by blocking IDO (a, representative plots and b) independent of effects upon the DC phenotype (c). Representative CFSE plots are of the proliferating blast (R2 region) cells (region gates and a representative R1 CFSE plot are shown in Fig. 3a). (d) shows the effects of blockade of IDO, IFN-γ and TGF-β upon mDC-induced T-cell proliferation. T-cell proliferation was determined by flow cytometry and CFSE dilution analysis and is represented by the weighted division index (WDI) or the WDI relative to DC alone. Changes in DC phenotype were determined by flow cytometry and are represented as GMFI relative to DC alone. Bars represent the mean of three or more independent donors ± SEM for the pooled data. *P ≤ 0·01 when compared with DC + AC + LPS.
Figure 9
Figure 9
Dendritic cells (DC) express functional IDO. The DC were stained with DiI and cultured alone, with lipopolysaccharide (LPS) alone or simultaneously with AC at a 1 : 5 ratio and stained for intracellular IDO (a). Peak intracellular IDO expression at 24 hr was confirmed at low levels in iDC and increased levels in response to LPS. Data are expressed as the percentage of cells positive for IDO as determined by flow cytometry. IDO expression at 24 hr was inhibited in the presence of a neutralising IFN-γ antibody and retinoic acid (b). Percentage inhibition of expression represents the percentage change of the percentage of cells positive for IDO as determined by flow cytometry. Enzymatic activity of IDO was determined at 24 hr as a ratio of kynurenine production to tryptophan catabolism by HPLC analysis (c). IDO activity was greatest in LPS-stimulated DC cultures but was reduced in the presence of apoptotic cells (AC). Results represent the mean of three independent experiments ± SEM. *P ≤ 0·05 when compared with DC alone.

Similar articles

Cited by

References

    1. Banchereau J, Steinman RM. Dendritic cells and the control of immunity. Nature. 1998;392:245–52. - PubMed
    1. Banchereau J, Palucka AK. Dendritic cells as therapeutic vaccines against cancer. Nat Rev Immunol. 2005;5:296–306. - PubMed
    1. Lutz MB, Schuler G. Immature, semi-mature and fully mature dendritic cells: which signals induce tolerance or immunity? Trends Immunol. 2002;23:445–9. - PubMed
    1. Albert ML. Death-defying immunity: do apoptotic cells influence antigen processing and presentation? Nat Rev Immunol. 2004;4:223–31. - PubMed
    1. Fiers W, Beyaert R, Declercq W, Vandenabeele P. More than one way to die: apoptosis, necrosis and reactive oxygen damage. Oncogene. 1999;18:7719–30. - PubMed

Publication types

MeSH terms