. 2007;8(12):R261.
doi: 10.1186/gb-2007-8-12-r261.

Gene-expression patterns reveal underlying biological processes in Kawasaki disease

Affiliations

Gene-expression patterns reveal underlying biological processes in Kawasaki disease

Stephen J Popper et al. Genome Biol. 2007.

Abstract

Background: Kawasaki disease (KD) is an acute self-limited vasculitis and the leading cause of acquired heart disease in children in developed countries. No etiologic agent(s) has been identified, and the processes that mediate formation of coronary artery aneurysms and abatement of fever following treatment with intravenous immunoglobulin (IVIG) remain poorly understood.

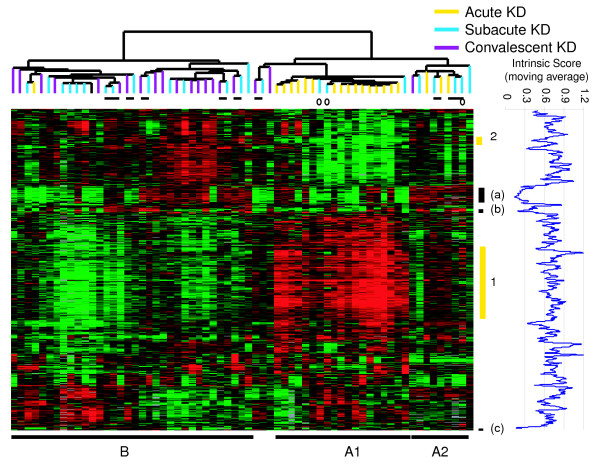
Results: In an initial survey, we used DNA microarrays to examine patterns of gene expression in peripheral whole blood from 20 children with KD; each was sampled during the acute, subacute, and convalescent phases of the illness. Acute KD was characterized by increased relative abundance of gene transcripts associated with innate immune and proinflammatory responses and decreased abundance of transcripts associated with natural killer cells and CD8+ lymphocytes. There was significant temporal variation in transcript levels during the acute disease phase and stabilization thereafter. We confirmed these temporal patterns in a second cohort of 64 patients, and identified additional inter-individual differences in transcript abundance. Notably, higher levels of transcripts of the gene for carcinoembryonic antigen-related cell adhesion molecule 1 (CEACAM1) were associated with an increased percentage of unsegmented neutrophils, fewer days of illness, higher levels of C-reactive protein, and subsequent non-response to IVIG; this last association was confirmed by quantitative reverse transcription PCR in a third cohort of 33 patients, and was independent of day of illness.

Conclusion: Acute KD is characterized by dynamic and variable gene-expression programs that highlight the importance of neutrophil activation state and apoptosis in KD pathogenesis. Our findings also support the feasibility of extracting biomarkers associated with clinical prognosis from gene-expression profiles of individuals with systemic inflammatory illnesses.


Figures

Figure 1
Figure 1
Patterns of transcript abundance in whole-blood samples from children with KD (cohort 1). Genes and samples were organized using hierarchical clustering; each row represents a single gene, and each column a single sample. Black indicates the median level of expression, red indicates greater expression than the median, green less expression, and gray missing data. Horizontal bars under the sample dendrogram at the top indicate samples from the same individual that cluster together; open circles represent samples obtained 1 or 2 days after IVIG treatment. Pretreatment acute KD samples are in yellow; early post-treatment subacute samples in light blue; late post-treatment convalescent samples in purple. Horizontal bars at the bottom of the figure indicate the sample groups mentioned in the text. A1 and A2 are clusters of acute samples; B is a cluster of subacute and convalescent samples. Vertical yellow bars (1 and 2) on the right mark the two gene clusters most strongly associated with the grouping of the pretreatment samples. The intrinsic score was graphed as a moving average of nine genes along the y-axis. The black vertical bars on the right lettered a, b, and c mark the three gene clusters with intrinsic scores more than 2 standard deviations away from the mean score of 0.742.
Figure 2
Figure 2
Patterns of transcript abundance as a function of illness day (days post-onset of fever). (a) Average transcript abundance of the two gene clusters associated with segregation of the acute and convalescent samples in cohort 1 (yellow bars in Figure 1). Closed symbols indicate pretreatment samples; open symbols indicate post-treatment samples. Black squares and red triangles represent transcripts expressed at higher (cluster 1) and lower (cluster 2) levels in acute KD, respectively. Solid (acute) and dashed (subacute and convalescent) black lines and red lines show the trend in expression levels of the genes in cluster 1 and cluster 2, respectively. (b,c) Average transcript abundance of (b) gene cluster 1 and (c) gene cluster 2 in cohort 2. The significance of the trend of expression over time in cohort 2 (p = 0.01 in (b), and p = 0.03 in (c)) was determined using Spearman rank correlations.
Figure 3
Figure 3
Clustering of KD samples on the basis of intrinsic gene-expression patterns. The 65 samples from 20 patients in Figure 1 were reorganized using the three gene clusters identified as having the lowest (strongest) intrinsic scores. a, b, and c indicate the same gene clusters as in Figure 1. Colors are as in Figure 1. Horizontal black bars indicate samples from the same patient that clustered together.
Figure 4
Figure 4
Association of transcript abundance and clinical parameters in patients with acute KD (cohort 2). (a) Genes and samples are organized using hierarchical clustering as in Figure 1. Sample clusters C and D are explained in the text. Numbered vertical bars at the right of the heat map indicate gene sets described in the text and in Additional data file 4. b) Correlation coefficients were calculated for the expression of each gene and each of the following clinical parameters: percentage segmented neutrophils, percentage unsegmented neutrophils (band), percentage total neutrophils, percentage lymphocytes, age at onset, illness day, erythrocyte sedimentation rate (ESR), and level of C-reative protein (CRP). A p value was calculated using permutation, and assigned a negative or positive value corresponding to the direction of the correlation. Results are portrayed as a moving average along the y-axis, with a window size of 15 clones, and were plotted for a given parameter if the p value was less than 0.01 (marked by dotted line) over 10 or more consecutive array elements.
Figure 5
Figure 5
Levels of CEACAM1 mRNA in pretreatment whole-blood samples from KD patients who subsequently responded (R) or failed to respond (NR) to IVIG treatment. Transcript levels were measured by quantitative RT-PCR, and normalized to TAF1B transcript levels. Black triangles, assay for both long (L) and short (S) splice forms of CEACAM1; gray triangles, L-form; open triangles: S-form. Horizontal bars indicate median relative expression level.

References

    1. Chang HY, Nuyten DS, Sneddon JB, Hastie T, Tibshirani R, Sorlie T, Dai H, He YD, van't Veer LJ, Bartelink H, et al. Robustness, scalability, and integration of a wound-response gene expression signature in predicting breast cancer survival. Proc Natl Acad Sci USA. 2005;102:3738–3743. doi: 10.1073/pnas.0409462102. - DOI - PMC - PubMed
    1. Alizadeh AA, Eisen MB, Davis RE, Ma C, Lossos IS, Rosenwald A, Boldrick JC, Sabet H, Tran T, Yu X, et al. Distinct types of diffuse large B-cell lymphoma identified by gene expression profiling. Nature. 2000;403:503–511. doi: 10.1038/35000501. - DOI - PubMed
    1. Lapointe J, Li C, Higgins JP, van de Rijn M, Bair E, Montgomery K, Ferrari M, Egevad L, Rayford W, Bergerheim U, et al. Gene expression profiling identifies clinically relevant subtypes of prostate cancer. Proc Natl Acad Sci USA. 2004;101:811–816. doi: 10.1073/pnas.0304146101. - DOI - PMC - PubMed
    1. Liu M, Popper SJ, Rubins KH, Relman DA. Early days: genomics and human responses to infection. Curr Opin Microbiol. 2006;9:312–319. doi: 10.1016/j.mib.2006.04.006. - DOI - PMC - PubMed
    1. Griffiths MJ, Shafi MJ, Popper SJ, Hemingway CA, Kortok MM, Wathen A, Rockett KA, Mott R, Levin M, Newton CR, et al. Genomewide analysis of the host response to malaria in Kenyan children. J Infect Dis. 2005;191:1599–1611. doi: 10.1086/429297. - DOI - PubMed

Publication types

MeSH terms