. 2008 Jan 15;313(2):844-62.
doi: 10.1016/j.ydbio.2007.10.037. Epub 2007 Nov 4.

Characterization of the Drosophila segment determination morphome

Affiliations

Characterization of the Drosophila segment determination morphome

Svetlana Surkova et al. Dev Biol. .

Abstract

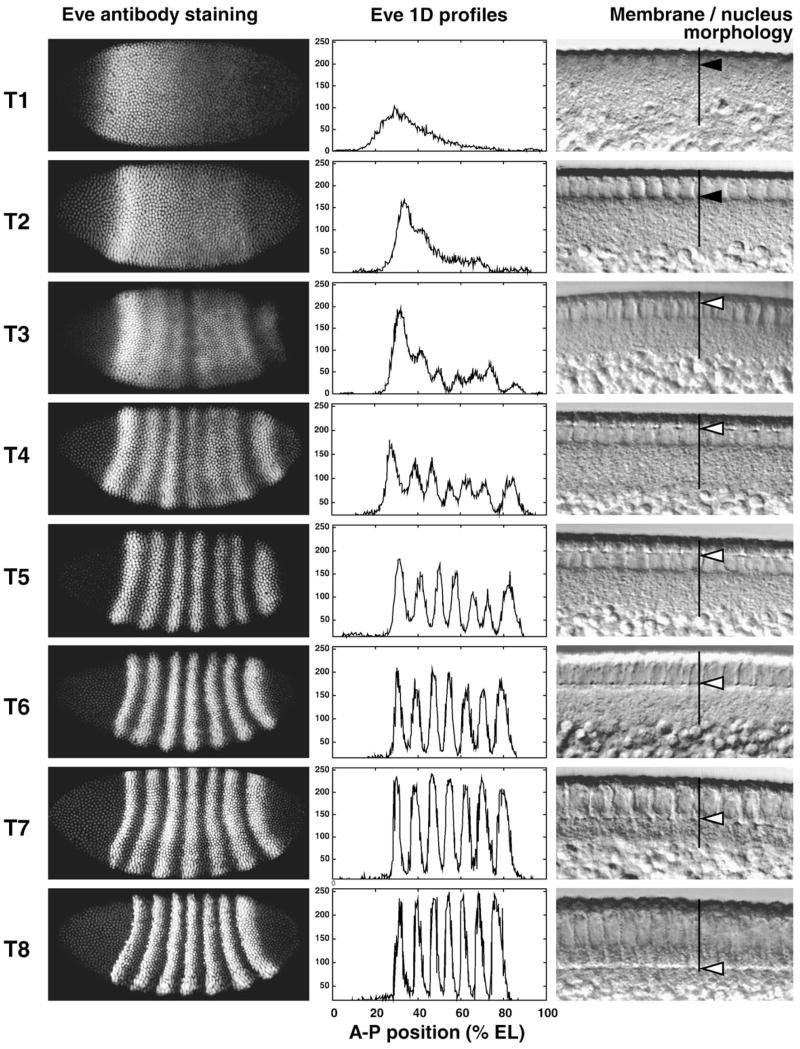
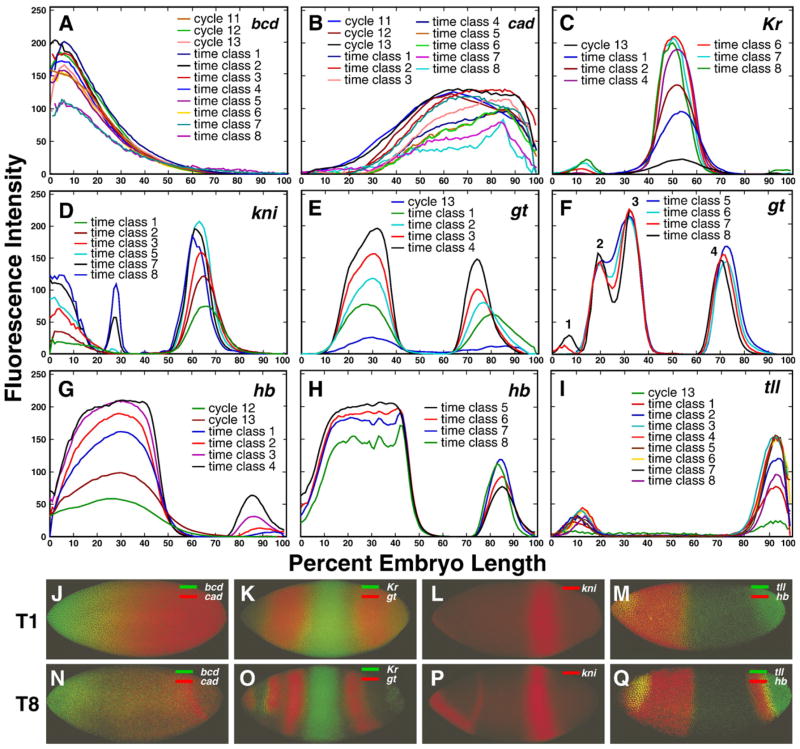
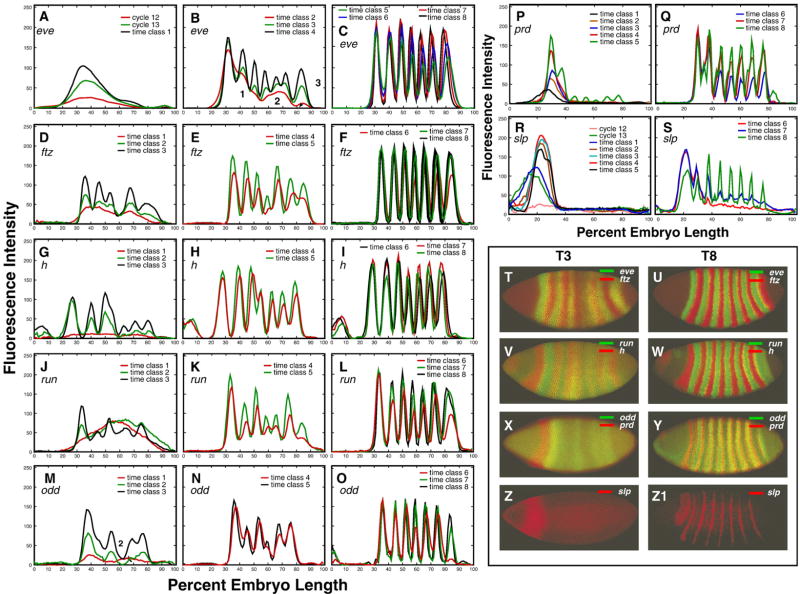
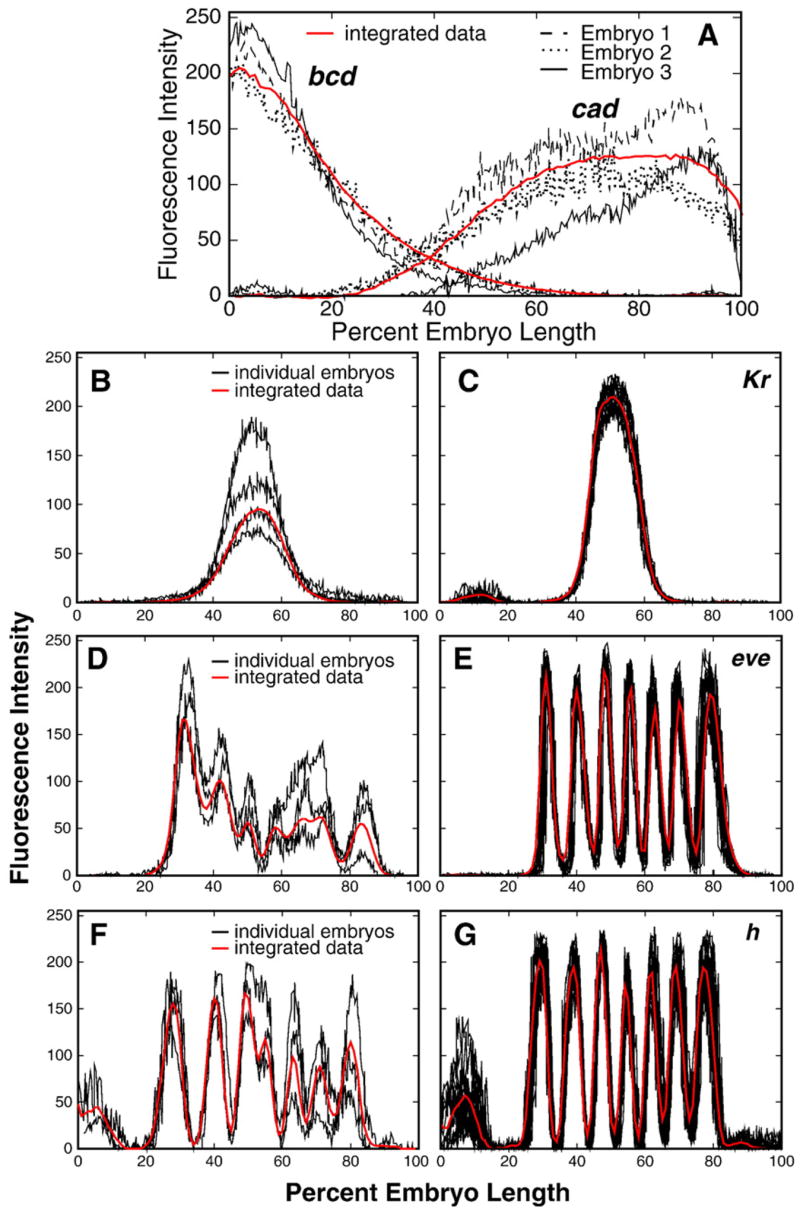
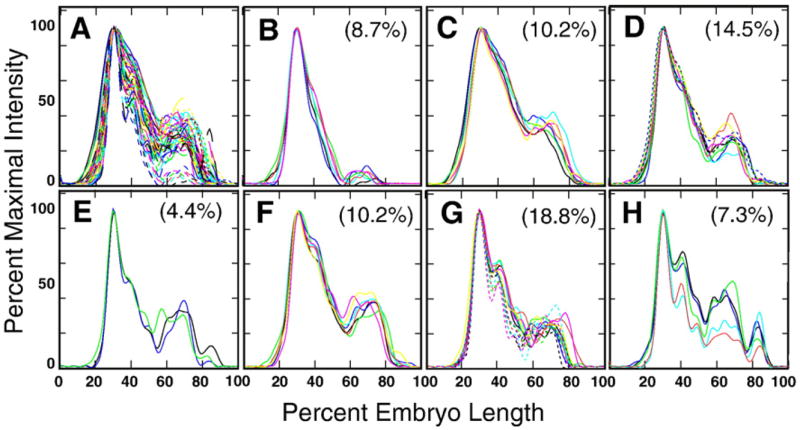
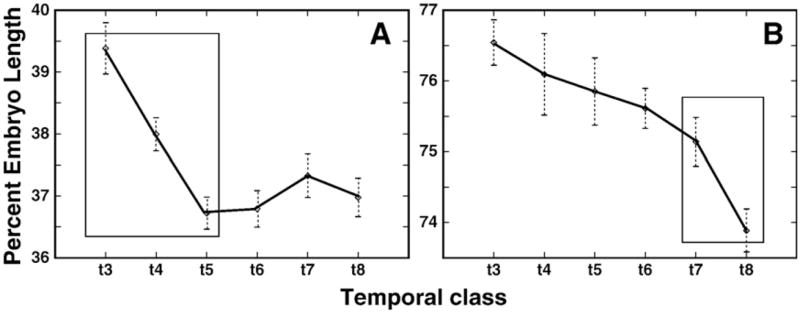
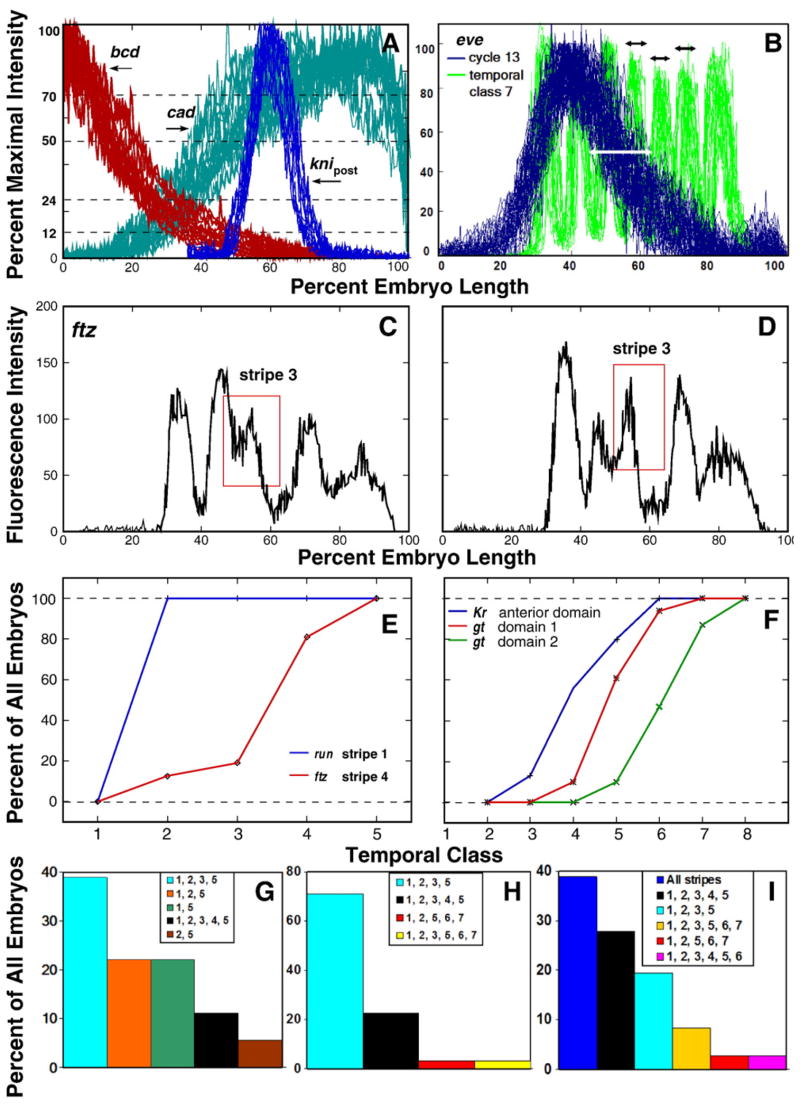
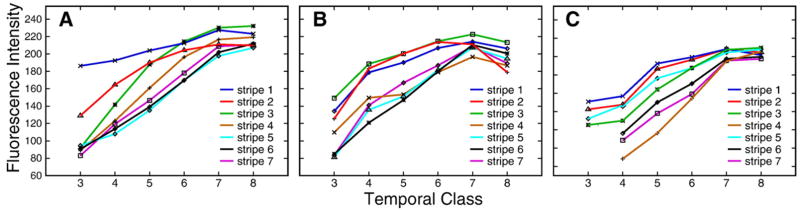
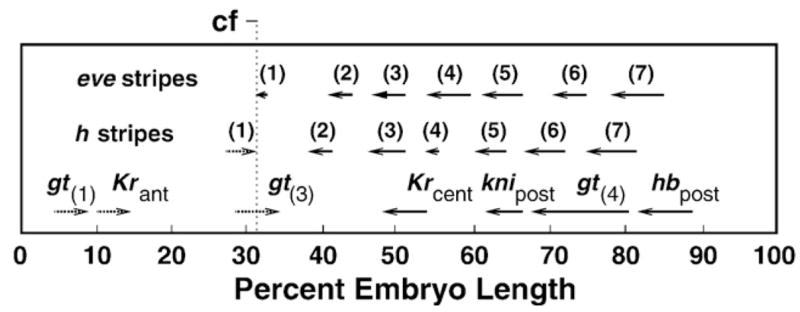
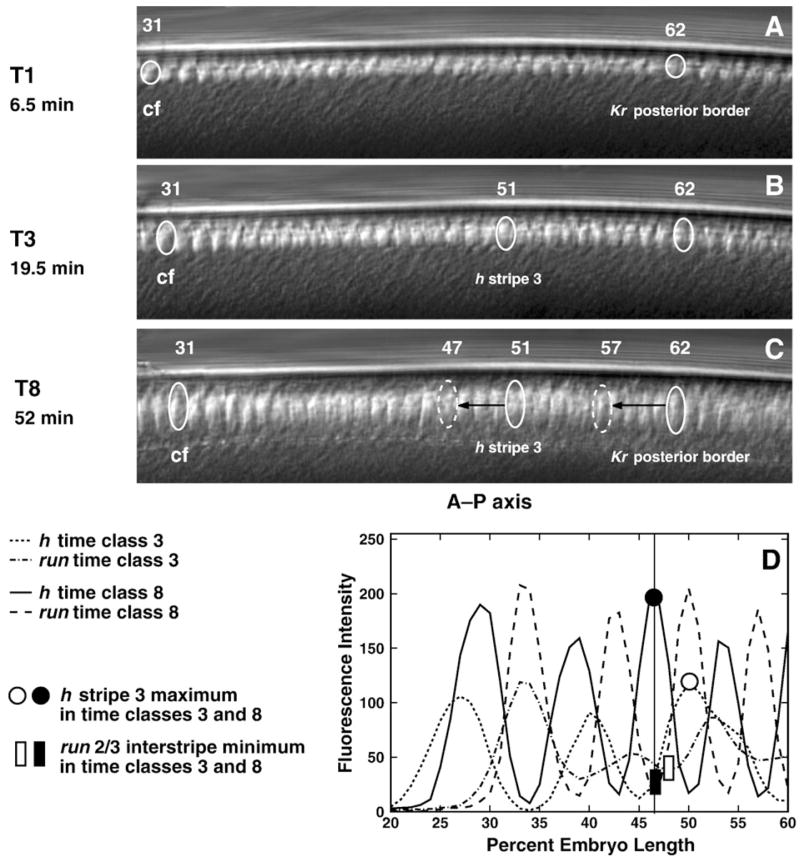
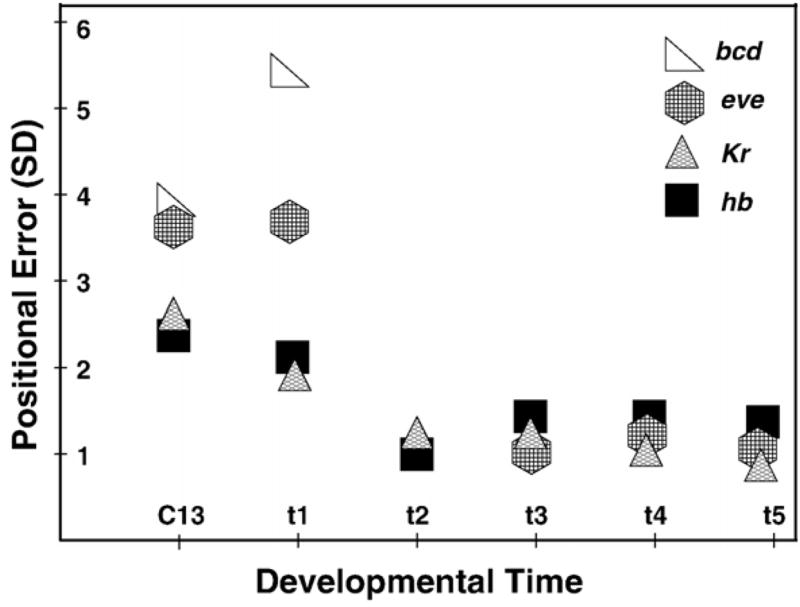
Here we characterize the expression of the full system of genes which control the segmentation morphogenetic field of Drosophila at the protein level in one dimension. The data used for this characterization are quantitative with cellular resolution in space and about 6 min in time. We present the full quantitative profiles of all 14 segmentation genes which act before the onset of gastrulation. The expression patterns of these genes are first characterized in terms of their average or typical behavior. At this level, the expression of all of the genes has been integrated into a single atlas of gene expression in which the expression levels of all genes in each cell are specified. We show that expression domains do not arise synchronously, but rather each domain has its own specific dynamics of formation. Moreover, we show that the expression domains shift position in the direction of the cephalic furrow, such that domains in the anlage of the segmented germ band shift anteriorly while those in the presumptive head shift posteriorly. The expression atlas of integrated data is very close to the expression profiles of individual embryos during the latter part of the blastoderm stage. At earlier times gap gene domains show considerable variation in amplitude, and significant positional variability. Nevertheless, an average early gap domain is close to that of a median individual. In contrast, we show that there is a diversity of developmental trajectories among pair-rule genes at a variety of levels, including the order of domain formation and positional accuracy. We further show that this variation is dynamically reduced, or canalized, over time. As the first quantitatively characterized morphogenetic field, this system and its behavior constitute an extraordinarily rich set of materials for the study of canalization and embryonic regulation at the molecular level.


Figures

Fig. 1
Fig. 1
The 8 temporal classes of cycle 14A. A typical embryo of each class is shown in each row. The left-hand panel shows an image of eve expression in that embryo; the middle panel shows the segmented expression pattern from the central 10% strip; the right-hand panel shows a high magnification DIC image of the blastoderm morphology. In the DIC images vertical black lines indicate the cortical cytoplasm, the black arrows in time classes 1 and 2 indicate the elongation of nuclei, and the white arrows in time classes 3–8 show the position of membrane front.
Fig. 2
Fig. 2
Temporal dynamics of expression of maternal and gap genes. The 1D integrated patterns of bcd (A), cad (B), Kr (C), kni (D), gt (E and F), hb (G and H) and tll (I) expression are shown for time points indicated in each panel. Expression domains within the gt expression pattern on panel F are numbered from anterior to posterior as indicated. Panels J–Q show representative confocal images of the expression of the genes shown in panels A–I in individual embryos belonging to temporal classes 1 (T1) and 8 (T8). Genes expressed in the same individual embryo are shown by different colors as given in the key for each panel.
Fig. 3
Fig. 3
Temporal dynamics of expression of pair-rule genes. The 1D integrated patterns of eve (A–C), ftz (D–F), h (G–I), run (J–L), odd (M–O), prd (P, Q) and slp (R–S) expression are shown for time points indicated in each panel. Numbers in panel B indicate the three transient domains of integrated eve expression during temporal class 2. Representative confocal images showing expression of these genes in individual embryos belonging to temporal classes 3 (T3) and 8 (T8) are shown in panels T–Z1. Genes expressed in the same individual embryo are shown by different colors as given in the key for each panel.
Fig. 4
Fig. 4
The variability of gene expression in individual embryos. bcd and cad patterns are shown in panel A for three individual embryos belonging to time class 2 and stained for the expression of both genes. Panels B, D and F show several of the most diverse patterns of early expression of Kr, eve and h in individual embryos from time classes 1, 3 and 4, respectively. The expression of Kr in time class 6 (C) eve (E) and h (G) in time class 7 is shown for a randomly chosen set of 13, 12 and 16 individual embryos respectively. For each gene the graph of the corresponding one-dimensional integrated data is shown in red.
Fig. 5
Fig. 5
Automated classification of eve profiles for 69 embryos in temporal class 2 by self-organizing maps (SOM). (A) An overlay of all eve profiles from temporal class 2. (B–H) Seven classes of expression patterns found by SOM with the percent of the total number of embryos belonging to that class.
Fig. 6
Fig. 6
Shifts and stripe formation within the odd pattern. (A) The shifts in position of odd stripes 1 (A) and 6 (B) are shown. The period when the largest shift occurs is marked by a box. Error bars indicate the standard errors of domain positions at each temporal class.
Fig. 7
Fig. 7
The variability in space, time, sequence and manner of domain formation. (A) The spatial variability of Bcd, Cad, and Kni domains in cycle 14A. The figure shows 26 embryos stained for bcd and cad and 18 embryos stained for kni. We show the posterior part of the kni pattern at 35–100% EL for temporal class 8. The thresholds corresponding to different percents of maximal expression are shown. (B) Spatial variability of the individual eve patterns in cycle 13 and temporal class 7 of cycle 14A. The variability in position of the posterior border of eve pattern is marked by white arrow. Black arrows mark the variability of eve stripes formed at the territory of posterior boundary of early eve. (C, D) Patterns of ftz expression in two embryos from time class 3 showing the variable mode of formation of stripe 3, which is marked with a red rectangle. (E, F) Temporal variability in formation of the pair-rule (E) and gap (F) domains indicated in the key. For each temporal class we show the percent of embryos in which the indicated domain has appeared. (G–I) Variability in the sequence of formation of stripes within the ftz pattern in temporal classes 2 (G), 3 (H), and 4 (I). Each bar shows the percent of embryos in which the indicated stripes are formed.
Fig. 8
Fig. 8
Temporal changes in the levels of expression of pair-rule genes. (A) eve, (B) h, (C) ftz; each curve corresponds to a particular stripe as shown in the key.
Fig. 9
Fig. 9
Summary of domain shifts. Direction of shifts is shown by arrows. Digits in brackets denote eve and h stripes, other domains are as indicated. Values of shifts were computed for the domain peaks over the following time intervals: from time classes 1 to 8 for gt(3), gt(4), Krcent and knipost; from time classes 2 to 8 for hbpost; from time class 3 to time class 8 for eve stripes 1–4 and 7 and h stripes 1–3; from time class 4 to time class 8 for Krant, eve stripes 5 and 6 and h stripes 4–7; from time classes 6 to 8 for gt(1). The approximate position of the prospective cephalic furrow (cf) is indicated.
Fig. 10
Fig. 10
In vivo nuclear motion compared to gene expression. Panels A–C are frames from a movie of the dorsal side of a living embryo, taken at the times indicated. Panel D is a graph of run and h expression patterns at temporal classes 3 and 8. In panels A–C, the identified nucleus 31 is at the approximate position of the presumptive cephalic furrow (cf); the identified nucleus 62 is at the position of the posterior border of Kr at temporal class 1 (Supplementary Table 1); and in panel B, the identified nucleus 51 is at the position of the maximum of h stripe 3 in temporal class 3. We track the positions of these nuclei (solid ovals) during time classes 1–8 for Kr and 3–8 for h. The dashed ovals in panel C indicate the A–P positions of the posterior border of Kr domain and h stripe 3 maximum in temporal class 8. Black arrows show the distance between positions of the tracked nuclei and the real positions of the corresponding expression domains in time class 8. Similar results were obtained from the ventral and dorsal sides of 15 embryos. Panel D shows that the positions of the maximum of h stripe 3 and the minimum of the run 2/3 interstripe, which have the same A–P positions in time class 8, shift position with respect to one another between temporal classes 3 and 8.
Fig. 11
Fig. 11
Dynamic filtration of the positional error at the level of zygotic gene expression. We consider the standard deviations (SD) in the positions of the posterior border of the anterior hb domain, maximum of the central Kr domain, and the posterior border of the early eve domain, which later corresponds to the position of eve stripe 3. Changes in the positional error of these domains are compared to the level of variability in position of the 12% concentration threshold of the Bcd protein gradient. All these features have approximately the same positions along the A–P axis of an embryo (45–55% EL). In cycle 14A we show the Bcd variability only for time class 1, as it remains at approximately the same level thereafter.

References

    1. Akam M. The molecular basis for metameric pattern in the Drosophila embryo. Development. 1987;101:1–22. - PubMed
    1. Azpiazu N, Frasch M. tinman and bagpipe: two homeo box genes that determine cell fates in the dorsal mesoderm of Drosophila. Genes Dev. 1993;7:1325–1340. - PubMed
    1. Benedyk MJ, Mullen JR, DiNardo S. odd-paired: a zinc finger pair-rule protein required for the timely activation of engrailed and wingless in Drosophila embryos. Genes Dev. 1994;8:105–117. - PubMed
    1. Blankenship JT, Wieschaus E. Two new roles for the Drosophila AP patterning system in early morphogenesis. Development. 2001;128:5129–5138. - PubMed
    1. Broomhead D, King G. Extracting qualitative dynamics from experimental data. Physica D. 1986;20:217–236.

Publication types