. 2007 Dec;3(12):e219.
doi: 10.1371/journal.pgen.0030219.

A mechanism misregulating p27 in tumors discovered in a functional genomic screen

Affiliations

A mechanism misregulating p27 in tumors discovered in a functional genomic screen

Carrie M Garrett-Engele et al. PLoS Genet. 2007 Dec.

Abstract

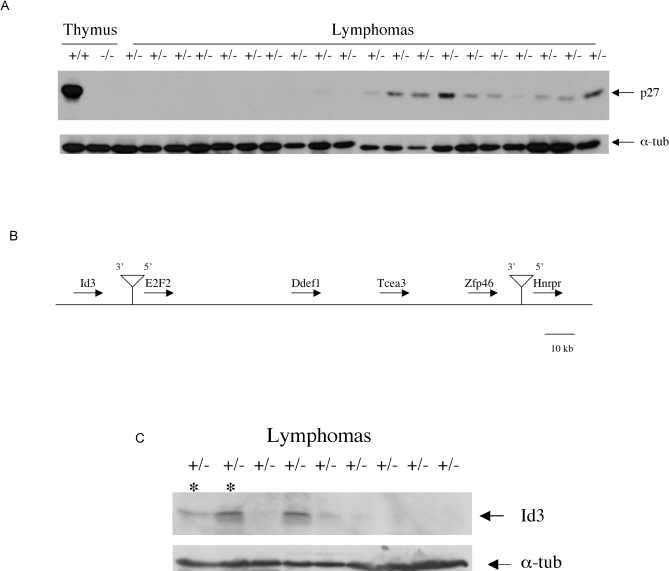
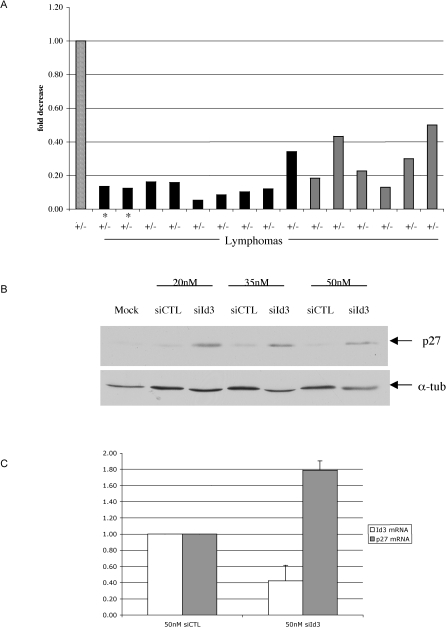
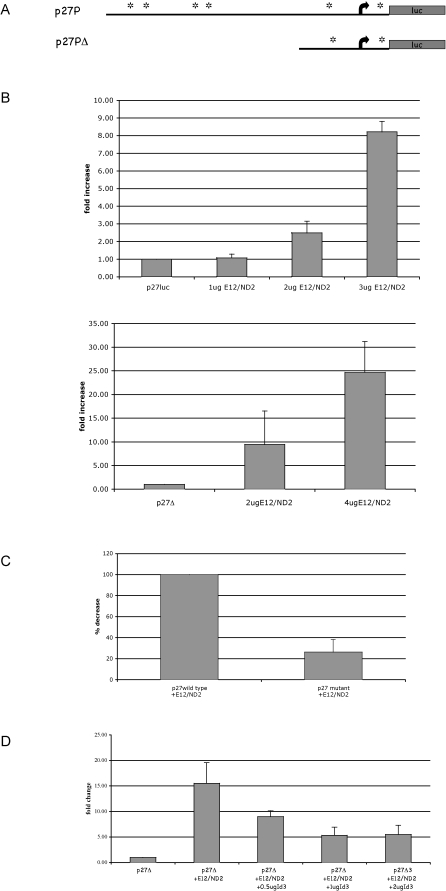
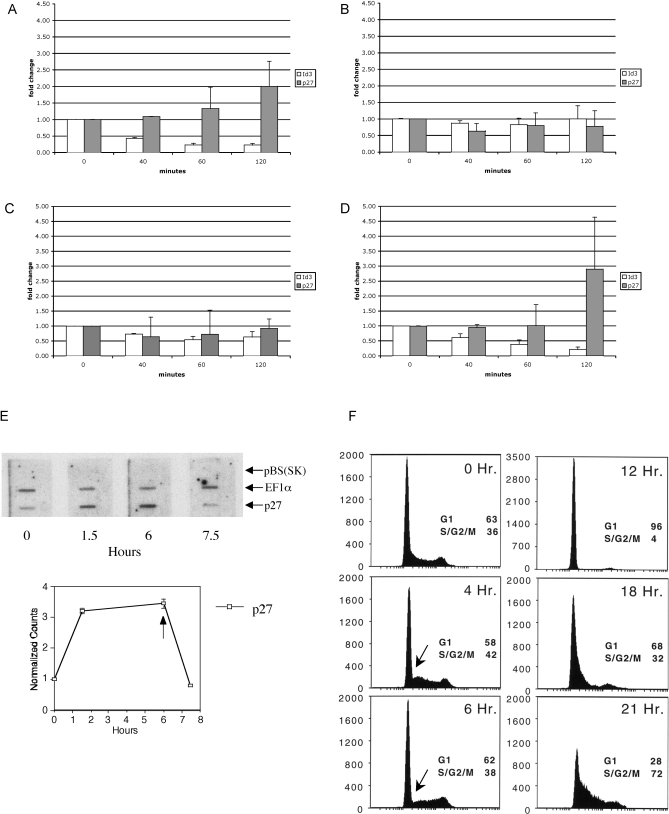
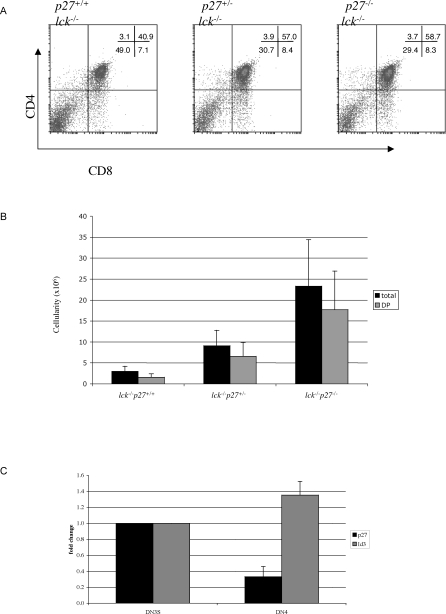
The cyclin-dependent kinase inhibitor p27(KIP1) is a tumor suppressor gene in mice, and loss of p27 protein is a negative prognostic indicator in human cancers. Unlike other tumor suppressors, the p27 gene is rarely mutated in tumors. Therefore misregulation of p27, rather than loss of the gene, is responsible for tumor-associated decreases in p27 protein levels. We performed a functional genomic screen in p27(+/-) mice to identify genes that regulate p27 during lymphomagenesis. This study demonstrated that decreased p27 expression in tumors resulted from altered transcription of the p27 gene, and the retroviral tagging strategy enabled us to pinpoint relevant transcription factors. inhibitor of DNA binding 3 (Id3) was isolated and validated as a transcriptional repressor of p27. We further demonstrated that p27 was a downstream target of Id3 in src-family kinase Lck-driven thymic lymphomagenesis and that p27 was an essential regulator of Lck-dependent thymic maturation during normal T-cell development. Thus, we have identified and characterized transcriptional repression of p27 by Id3 as a new mechanism decreasing p27 protein in tumors.


Conflict of interest statement

Competing interests. The authors have declared that no competing interests exist.

Figures

Figure 1
Figure 1. Analysis of M-MuLV Induced Lymphomas from p27 +/− Mice
(A) Western analysis of p27 protein levels in p27 wild-type and p27 / thymus tissues and 20 of the 44 p27 +/− lymphomas. The blots were probed with α-tubulin as a loading control. (B) A schematic of the region on Chromosome 4 flanking the retroviral insertion sites is shown. The relative positions of Id3, E2F2, Ddefl1, Tcea3, Zfp46, and Hnrpr are indicated. (C) Id3 protein levels in a subset of the lymphomas from (A) p27 +/− lymphomas. α-tubulin is shown as a loading control. The tumors with Id3 retroviral insertions near Id3 are indicated with an asterisk. The lymphoma with M-MuLv insertion closest to Id3 has the highest level of Id3 protein. doi:10.1371/journal.pgen.0030219.g001
Figure 2
Figure 2. p27 Transcript Is Regulated in p27 +/− Lymphomas and Normal Cells
(A) p27 transcript levels in p27 +/− thymus and p27 +/− lymphomas were determined by quantitative RT-PCR using probe and primer sequences at the border of exons 1 and 2. The amount of RNA in each sample was normalized to HPRT1 gene expression. The fold change observed is relative to the p27 transcript levels in the p27 +/− normal thymus indicated by the striped bar. The p27 low lymphomas from Figure 1A are shown in black, and lymphomas with higher p27 protein are shown in gray. An asterisk marks lymphomas with retroviral insertions near Id3. (B) p27 protein levels increase dependent on the presence of the Id3 siRNA. α-tubulin expression is shown as a loading control. (C) Quantitative RT- PCR indicates Id3 siRNA decreased Id3 mRNA and increased p27 mRNA abundance. HPRT1 mRNA was used to normalize RNA amounts in each sample. All primer-probe sets are located at exon borders. doi:10.1371/journal.pgen.0030219.g002
Figure 3
Figure 3. Id3 Regulates Expression of p27 Promoter Reporter Construct
(A) A schematic of the full-length p27 promoter and a minimal p27 promoter are shown. The E-box sequences CANNTG are marked by asterisks. (B) The E12/NeuroD2 E-protein heterodimers activate the full-length and minimal p27 promoters. (C) The percent induction of the mutant p27 minimal promoter, with three of the four conserved bases in the E boxes mutated (CANNTG to CGNNAT), is shown relative to the wild-type promoter. (D) Id3 represses E-protein activation of the p27 minimal promoter. The SV40-β-galactosidase or CMV-β-galactosidase plasmids were used as an internal control for each sample. doi:10.1371/journal.pgen.0030219.g003
Figure 4
Figure 4. p56Lck Regulates p27 Gene Expression Via Id3 in Lymphoma Cells
Quantitative RT-PCR detected transcript levels for Id3 and p27 in PP1 inhibited (A) Lck-expressing cells LGY-6871, (B) SV40–180 large T-protein transformed cells, (C) LGY-6871 cells infected with an Id3 retrovirus, and (D) LGY-6871 cells infected with the control retrovirus are shown in the graph. PP1 was added immediately after the time-0 timepoint was collected, and later aliquots were collected at the specified times. The Id3 probe and primers detect endogenous and retroviral expressed Id3. HPRT1 gene expression was used to normalize each sample. The fold change in transcript levels is relative to the 0 timepoint. (E) Representative autoradiograph of nuclear run-on assays from PP1 inhibited Lck-expressing cells LGY-10442–2 is shown and quantitative data from three experiments. The p27 transcript levels were normalized to EF1α transcript levels. PP1 was added to the culture after the 0 timepoint and washed out after 6 h as indicated by the arrow. (F) FACS analysis of PP1-inhibited Lck-transformed lymphoma cells LGY-10442–2. The cells were treated as described for (E). The arrow indicates depletion of early S-phase cells doi:10.1371/journal.pgen.0030219.g004
Figure 5
Figure 5. Loss of p27 Rescues the lck / Phenotype
(A) Representative FACS analysis of thymi from lck / p27+/+, lck / p27 +/−, and lck / p27 / mice indicating loss of one copy of the p27 gene rescues the lck / phenotype. (B) The total cellularity for thymi and DP cells from all three genotypes are shown in the graph. Data were collected from three lck / p27+/+, seven lck / p27 +/−, and seven lck / p27 / mice. (C) Quantitative RT-PCR detected transcript levels for Id3 and p27 in wild-type small DN3 and DN4 cells. The fold change in the mRNA levels in the DN4 cells is relative to the DN3 cells. doi:10.1371/journal.pgen.0030219.g005

References

    1. Polyak K, Lee MH, Erdjument-Bromage H, Koff A, Roberts JM, et al. Cloning of p27Kip1, a cyclin-dependent kinase inhibitor and a potential mediator of extracellular antimitogenic signals. Cell. 1994;78:59–66. - PubMed
    1. Kiyokawa H, Koff A. Roles of cyclin-dependent kinase inhibitors: lessons from knockout mice. Curr Top Microbiol Immunol. 1998;227:105–120. - PubMed
    1. Fero ML, Rivkin M, Tasch M, Porter P, Carow CE, et al. A syndrome of multiorgan hyperplasia with features of gigantism, tumorigenesis, and female sterility in p27(Kip1)-deficient mice. Cell. 1996;85:733–744. - PubMed
    1. Zhang S, Lawless VA, Kaplan MH. Cytokine-stimulated T lymphocyte proliferation is regulated by p27Kip1. J Immunol. 2000;165:6270–6277. - PubMed
    1. Nourse J, Firpo E, Flanagan WM, Coats S, Polyak K, et al. Interleukin-2-mediated elimination of the p27Kip1 cyclin-dependent kinase inhibitor prevented by rapamycin. Nature. 1994;372:570–573. - PubMed

Publication types

MeSH terms

Substances