

Novel roles for selected genes in meiotic DNA processing
- PMID: 18069899
- PMCID: PMC2134943
- DOI: 10.1371/journal.pgen.0030222
Novel roles for selected genes in meiotic DNA processing
Abstract
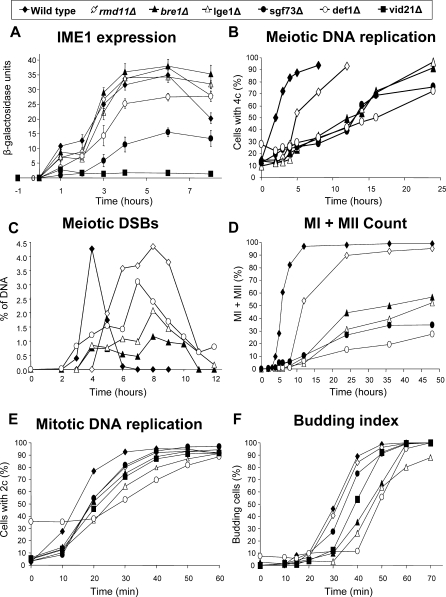
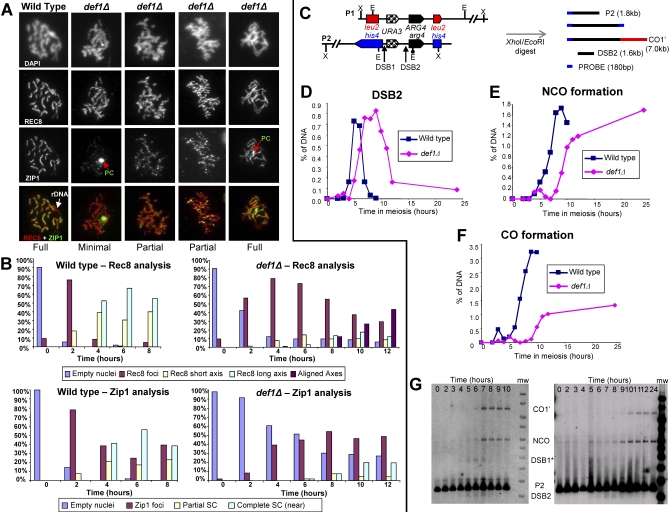
High-throughput studies of the 6,200 genes of Saccharomyces cerevisiae have provided valuable data resources. However, these resources require a return to experimental analysis to test predictions. An in-silico screen, mining existing interaction, expression, localization, and phenotype datasets was developed with the aim of selecting minimally characterized genes involved in meiotic DNA processing. Based on our selection procedure, 81 deletion mutants were constructed and tested for phenotypic abnormalities. Eleven (13.6%) genes were identified to have novel roles in meiotic DNA processes including DNA replication, recombination, and chromosome segregation. In particular, this analysis showed that Def1, a protein that facilitates ubiquitination of RNA polymerase II as a response to DNA damage, is required for efficient synapsis between homologues and normal levels of crossover recombination during meiosis. These characteristics are shared by a group of proteins required for Zip1 loading (ZMM proteins). Additionally, Soh1/Med31, a subunit of the RNA pol II mediator complex, Bre5, a ubiquitin protease cofactor and an uncharacterized protein, Rmr1/Ygl250w, are required for normal levels of gene conversion events during meiosis. We show how existing datasets may be used to define gene sets enriched for specific roles and how these can be evaluated by experimental analysis.
Conflict of interest statement
Competing interests. The authors have declared that no competing interests exist.
Figures


Similar articles
-
XRS2, a DNA repair gene of Saccharomyces cerevisiae, is needed for meiotic recombination.Genetics. 1992 Nov;132(3):651-64. doi: 10.1093/genetics/132.3.651. Genetics. 1992. PMID: 1468624 Free PMC article.
-
A new Saccharomyces cerevisiae strain with a mutant Smt3-deconjugating Ulp1 protein is affected in DNA replication and requires Srs2 and homologous recombination for its viability.Mol Cell Biol. 2004 Jun;24(12):5130-43. doi: 10.1128/MCB.24.12.5130-5143.2004. Mol Cell Biol. 2004. PMID: 15169880 Free PMC article.
-
Nutritional regulation of late meiotic events in Saccharomyces cerevisiae through a pathway distinct from initiation.Mol Cell Biol. 1996 Jun;16(6):3222-32. doi: 10.1128/MCB.16.6.3222. Mol Cell Biol. 1996. PMID: 8649433 Free PMC article.
-
Meiosis. DNA branching during meiotic recombination.Curr Biol. 1994 May 1;4(5):448-51. doi: 10.1016/s0960-9822(00)00100-7. Curr Biol. 1994. PMID: 7922362 Review.
-
ZMM proteins during meiosis: crossover artists at work.Chromosome Res. 2007;15(5):591-605. doi: 10.1007/s10577-007-1150-1. Chromosome Res. 2007. PMID: 17674148 Review.
Cited by
-
A High-Copy Suppressor Screen Reveals a Broad Role of Prefoldin-like Bud27 in the TOR Signaling Pathway in Saccharomyces cerevisiae.Genes (Basel). 2022 Apr 24;13(5):748. doi: 10.3390/genes13050748. Genes (Basel). 2022. PMID: 35627133 Free PMC article.
-
Proteasome-mediated processing of Def1, a critical step in the cellular response to transcription stress.Cell. 2013 Aug 29;154(5):983-995. doi: 10.1016/j.cell.2013.07.028. Cell. 2013. PMID: 23993092 Free PMC article.
-
Deletion of the DEF1 gene does not confer UV-immutability but frequently leads to self-diploidization in yeast Saccharomyces cerevisiae.DNA Repair (Amst). 2018 Oct;70:49-54. doi: 10.1016/j.dnarep.2018.08.026. Epub 2018 Aug 23. DNA Repair (Amst). 2018. PMID: 30172224 Free PMC article.
-
A genetic screen for increased loss of heterozygosity in Saccharomyces cerevisiae.Genetics. 2008 Jul;179(3):1179-95. doi: 10.1534/genetics.108.089250. Epub 2008 Jun 18. Genetics. 2008. PMID: 18562670 Free PMC article.
-
Replication-IDentifier links epigenetic and metabolic pathways to the replication stress response.Nat Commun. 2025 Feb 6;16(1):1416. doi: 10.1038/s41467-025-56561-y. Nat Commun. 2025. PMID: 39915438 Free PMC article.
References
-
- Hazbun TR, Malmstrom L, Anderson S, Graczyk BJ, Fox B, et al. Assigning function to yeast proteins by integration of technologies. Mol Cell. 2003;12:1353. - PubMed
-
- Uetz P, Giot L, Cagney G, Mansfield TA, Judson A, et al. A comprehensive analysis of protein-protein interactions in Saccharomyces cerevisiae. Nature. 2000;403:623. - PubMed
-
- Gavin AC, Aloy P, Grandi P, Krause R, Boesche M, et al. Proteome survey reveals modularity of the yeast cell machinery. Nature. 2006;440:631. - PubMed
-
- Gavin AC, Bosche M, Krause R, Grandi P, Marzioch M, et al. Functional organization of the yeast proteome by systematic analysis of protein complexes. Nature. 2002;415:141. - PubMed
Publication types
MeSH terms
Substances
Grants and funding
LinkOut - more resources
Full Text Sources
Molecular Biology Databases
