. 2007 Dec 24;204(13):3157-72.
doi: 10.1084/jem.20071677. Epub 2007 Dec 10.

Dual GPCR and GAG mimicry by the M3 chemokine decoy receptor

Affiliations

Dual GPCR and GAG mimicry by the M3 chemokine decoy receptor

Jennifer M Alexander-Brett et al. J Exp Med. .

Abstract

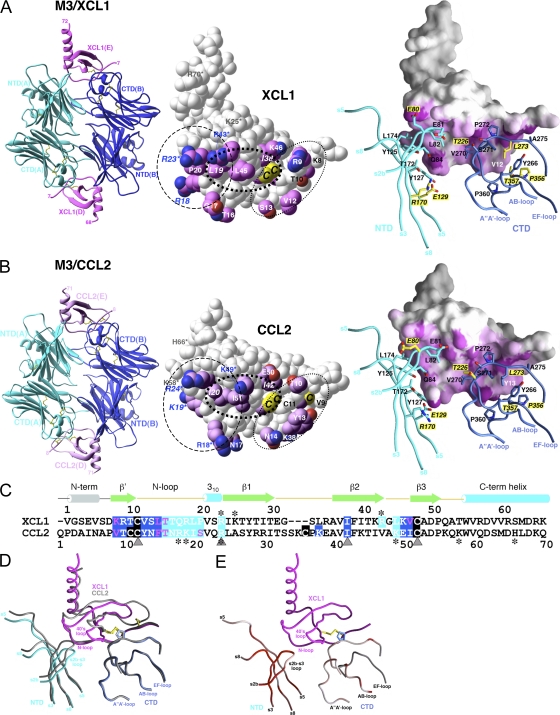
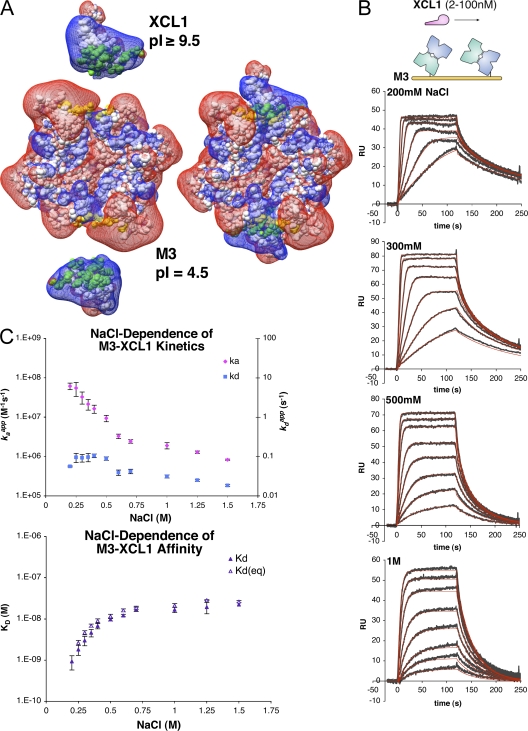
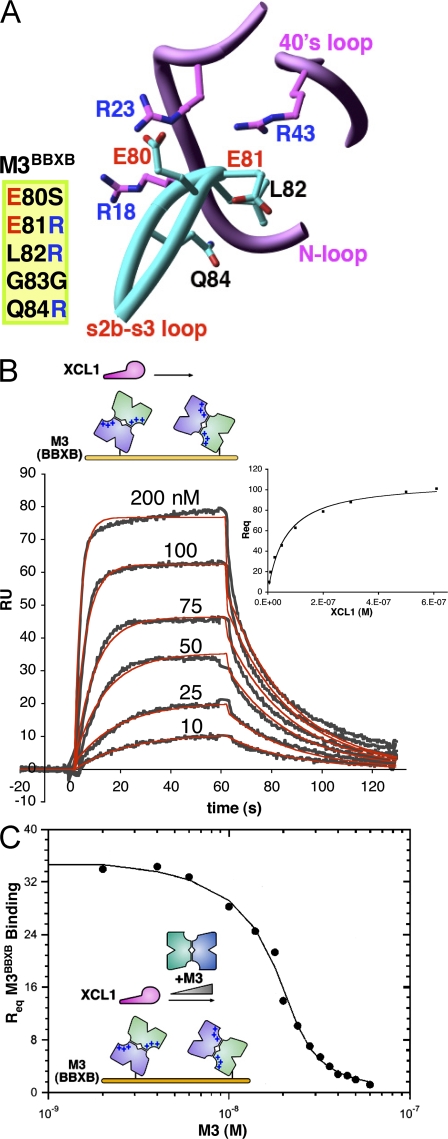
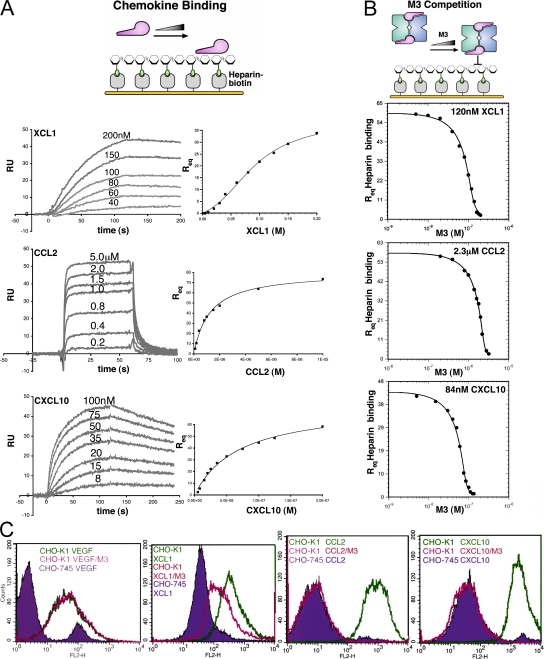
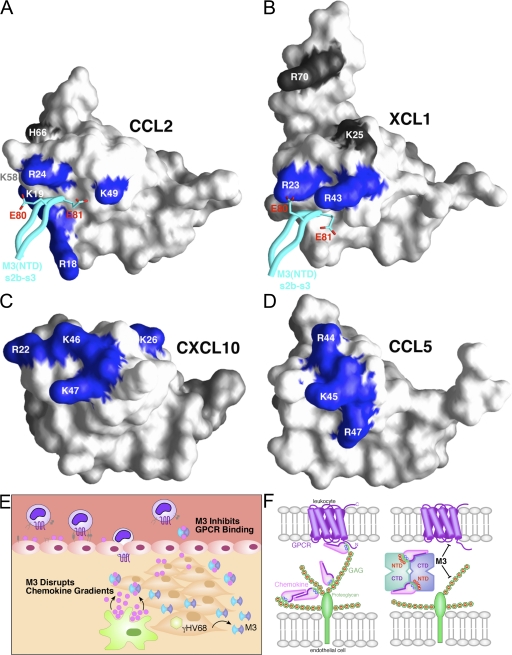
Viruses have evolved a myriad of evasion strategies focused on undermining chemokine-mediated immune surveillance, exemplified by the mouse gamma-herpesvirus 68 M3 decoy receptor. Crystal structures of M3 in complex with C chemokine ligand 1/lymphotactin and CC chemokine ligand 2/monocyte chemoattractant protein 1 reveal that invariant chemokine features associated with G protein-coupled receptor binding are primarily recognized by the decoy C-terminal domain, whereas the N-terminal domain (NTD) reconfigures to engage divergent basic residue clusters on the surface of chemokines. Favorable electrostatic forces dramatically enhance the association kinetics of chemokine binding by M3, with a primary role ascribed to acidic NTD regions that effectively mimic glycosaminoglycan interactions. Thus, M3 employs two distinct mechanisms of chemical imitation to potently sequester chemokines, thereby inhibiting chemokine receptor binding events as well as the formation of chemotactic gradients necessary for directed leukocyte trafficking.


Figures

Figure 1.
Figure 1.
Crystal structures of M3–XCL1 and M3–CCL2 complexes. Structures of (A) M3–XCL1 and (B) M3–CCL2. (left) Each complex displays a 2:2 stoichiometry, with M3 chains labeled A and B and chemokines labeled D and E. (middle) Space-fill models of XCL1 (E) and CCL2 (E). Sidechains of contact residues are highlighted in magenta. Shared chemokine features are circled, with residues in the basic cluster (dashed line) labeled in blue; also shown is the N-terminal segment (dotted line), with residues forming the antiparallel β strand labeled in black, as well as the hydrophobic cluster (bold dotted line). Cysteines of the CC and C motifs are labeled on CCL2 (C11, C12, and C52; note that C36 is not visible) and XCL1 (C11 and C48), respectively. The single disulfide in XCL1 is structurally equivalent to the second disulfide (C12–C52) in CCL2 and is referred to as the invariant disulfide. Conserved sidechain contacts are italicized, and GAG-binding residues are indicated by asterisks (references 35, 38). (right) The chemokine contact surface is highlighted in magenta, with 2.5–3.5-Å (short-range) contacts in a darker shade and 3.5–5-Å contacts in a gradient from magenta to white. M3 sidechain contacts are shown in stick form and labeled, with differential contacts highlighted with yellow labels and noncontacting residues shown in yellow for each structure. (C) Structure-based sequence alignment of XCL1 (–65) and CCL2 (–70). All residues that contact M3 NTD or CTD are highlighted in cyan and blue, respectively, with disulfide-forming cysteines in black. Conserved sidechain contacts are indicated by gray triangles and GAG-binding residues with asterisks. (D) Conformational rearrangement of M3 NTD with the Cα trace of M3–CCL2 in gray and M3–XCL1 superimposed in blue, cyan, and magenta. (E) RMSD (all atoms) between M3 in complex with XCL1 and CCL2 is highlighted on the trace of M3–XCL1 as a gradient from white to red (from 0.5 to ≥3 Å). Figures were prepared using Ribbons (reference 67) and GRASP (reference 68) software, as previously described, and the chemokine E chain interface is shown as the reference in all figures.
Figure 2.
Figure 2.
Kinetic analysis of M3–XCL1 interactions. (A) Corey-Pauling-Koltun model of M3, XCL1, and the M3–XCL1 complex with an overlay of electrostatic potential maps from APBS (150 mM NaCl) in mesh, contoured at 0.7 kT/e and displayed using Chimera, as previously described (reference 69). Surface area buried in the complex is highlighted in green (XCL1) and yellow (M3), and both are labeled with experimental pI's. (B) Representative SPR sensorgrams (gray) and fits (red) for XCL1 binding to M3 as a function of NaCl. (C) Binding constants for the NaCl range investigated (from 200 mM to 1.5 M; Table III). (top) The on rate (kaapp) and off rate (kdapp) as a function of NaCl (mean ± SEM). (bottom) KD (from the ratio of on and off rates) and KD(eq) (from nonlinear fit to Req values; mean ± SEM).
Figure 3.
Figure 3.
M3BBXB kinetics and M3 competition assay. (A) Positions mutated in M3BBXB and adjacent basic residues on XCL1 are shown in ball and stick form (oriented as in Fig. 1 A), and mutations are listed. Adjacent sections of the chemokine backbone are not shown, for clarity. (B) XCL1 binding to M3BBXB. Representative sensorgrams (gray) and Req values (plot, inset) are shown with corresponding fits (red and black, respectively; Table IV). (C) Competition assay to determine the solution affinity for M3 binding to XCL1 at 150 mM NaCl. Competition titration curve for coinjected M3 binding to XCL1 in competition with immobilized M3BBXB is shown with a corresponding fit to the data (Table IV).
Figure 4.
Figure 4.
Heparin-binding and M3 competition assays. (A, left) Representative SPR traces for chemokines binding to immobilized heparin. Note that chemokines display multiphasic-binding kinetics, which therefore precluded kinetic analysis using a simple bimolecular interaction model. (right) Req values for chemokine binding to heparin with corresponding nonlinear fits to obtain KD for each interaction (Table V). Equilibrium (Req) binding for CCL2 and CXCL10 was described well by a simple 1:1 interaction model; however, XCL1 displayed cooperative binding behavior and, thus, a more complex model was used (Supplemental materials and methods). (B) Competition titration curves with corresponding fits for coinjected M3 inhibition of XCL1, CCL2, and CXCL10 binding to immobilized heparin (Table V). (C) FACS analysis of chemokine binding to CHO-K1 (wild-type) and CHO-745 (GAG-deficient) cell lines. Staining of CHO-745 cells is shown in violet for XCL1, CCL2, CXCL10, and VEGF control, with staining in the absence (green) and presence (magenta) of M3 superimposed.
Figure 5.
Figure 5.
Dual GPCR and GAG inhibition by M3. (A) Surface representation of CCL2 is shown, with previously identified GAG-binding residues labeled (references 35, 44). Four out of the six residues defined by mutational analysis as creating the GAG-binding epitope of CCL2 are directly contacted by M3 and are colored blue (Arg18, Lys19, Arg24, and Lys49), whereas the noncontacted residues are colored gray (Lys58 and His66). The M3 NTD s2b-s3 loop is displayed in cyan, with acidic contact residues E80 and E81 shown in stick form. (B) M3 contacts two out of the four previously identified GAG-binding residues of XCL1 (R23 and R43, blue; K25 and R70, gray; reference 38). (C) The structure of human CXCL10 (reference 70) is shown, with the four conserved GAG-binding residues identified by mutational analysis in mouse IP-10 highlighted in blue (R22, K26, K46, and K47; reference 45). (D) The structure of CCL5 is shown, with GAG-binding residues established by structural and mutational analysis highlighted in blue (R44, K45, and R47; references 46, 47). (E) Proposed model for the disruption of chemokine gradients by M3 during MHV68 infection. (F) Schematic of M3 NTD-mediated disruption of chemokine interactions with cell-surface GAGs (green) and CTD-mediated disruption of chemokine interactions with GPCRs (violet). The electrostatic potential is indicated by red (+) and blue (−) on chemokines and GAGs, respectively.

References

    1. Murphy, P.M. 2002. International Union of Pharmacology. XXX. Update on chemokine receptor nomenclature. Pharmacol. Rev. 54:227–229. - PubMed
    1. Rollins, B.J. 1997. Chemokines. Blood. 90:909–928. - PubMed
    1. Linhardt, R.J., and T. Toida. 2004. Role of glycosaminoglycans in cellular communication. Acc. Chem. Res. 37:431–438. - PubMed
    1. Lortat-Jacob, H., A. Grosdidier, and A. Imberty. 2002. Structural diversity of heparan sulfate binding domains in chemokines. Proc. Natl. Acad. Sci. USA. 99:1229–1234. - PMC - PubMed
    1. Proudfoot, A.E., T.M. Handel, Z. Johnson, E.K. Lau, P. LiWang, I. Clark-Lewis, F. Borlat, T.N. Wells, and M.H. Kosco-Vilbois. 2003. Glycosaminoglycan binding and oligomerization are essential for the in vivo activity of certain chemokines. Proc. Natl. Acad. Sci. USA. 100:1885–1890. - PMC - PubMed

Publication types