. 2008 Feb;52(2):539-50.
doi: 10.1128/AAC.01061-07. Epub 2007 Dec 10.

In vivo pharmacodynamic characterization of anidulafungin in a neutropenic murine candidiasis model

Affiliations

In vivo pharmacodynamic characterization of anidulafungin in a neutropenic murine candidiasis model

D Andes et al. Antimicrob Agents Chemother. 2008 Feb.

Abstract

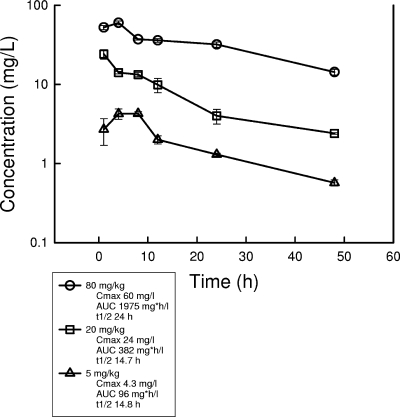
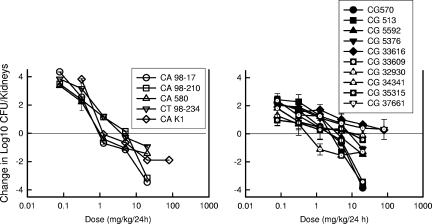
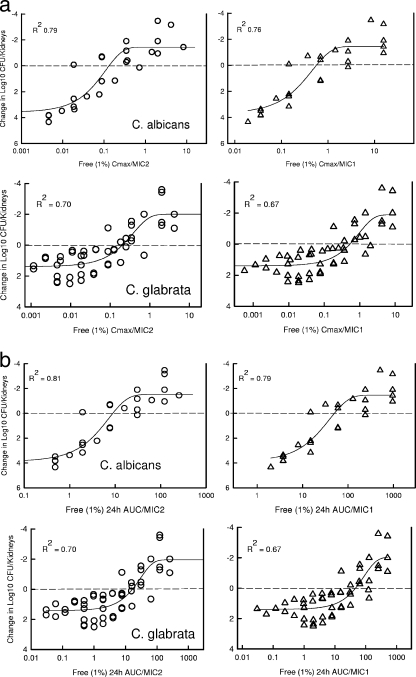
Multiple in vivo studies have characterized the pharmacodynamics of drugs from the triazole and polyene antifungal drug classes. Fewer studies have investigated these pharmacodynamic relationships for the echinocandin drug class. We used a neutropenic murine model of disseminated Candida albicans, Candida tropicalis, and Candida glabrata infection to characterize the time course of activity of the new echinocandin anidulafungin. The pharmacokinetic-pharmacodynamic (PK-PD) indices (the percentage of time that the drug concentration was above the MIC, the ratio of the area under the concentration-time curve from 0 to 24 h [AUC(0-24)] to the MIC, and the ratio of the maximum serum drug concentration [C(max)] to the MIC) were correlated with in vivo efficacy, as measured by organism numbers in kidney cultures after 96 h of therapy. The kinetics following intraperitoneal anidulafungin dosing in neutropenic infected mice were monitored. Peak levels and AUCs were linear over the 16-fold dose range studied. The drug elimination half-life in serum ranged from 14 to 24 h. Single-dose postantifungal-effect studies demonstrated prolonged suppression of organism regrowth after serum anidulafungin levels had fallen below the MIC. Of the four dosing intervals studied, treatment with the more widely spaced dosing regimens was most efficacious, suggesting the C(max)/MIC ratio as the PK-PD index most predictive of efficacy. Nonlinear regression analysis suggested that both the C(max)/MIC and AUC/MIC ratios were strongly predictive of treatment success. Studies were then conducted with 13 additional C. albicans, C. tropicalis, and C. glabrata isolates with various anidulafungin susceptibilities (MICs of anidulafungin for these strains, 0.015 to 2.0 microg/ml) to determine if similar C(max)/MIC and AUC(0-24)/MIC ratios for these isolates were associated with efficacy. The anidulafungin exposures associated with efficacy were similar among Candida species.


Figures

FIG. 1.
FIG. 1.
Pharmacokinetics of anidulafungin in sera of neutropenic infected mice following three single intraperitoneal doses of 5, 20, and 80 mg/kg. Each symbol represents the mean concentration for three mice and triplicate assays. The error bars represent the standard deviations. t1/2, half-life of the drug in serum.
FIG. 2.
FIG. 2.
Results of single-dose time-kill and PAFE studies of anidulafungin against strains of C. albicans and C. glabrata following three intraperitoneal doses of 1.25, 5, and 20 mg/kg. Each symbol represents the mean organism burden in the kidneys of three mice (six kidneys, plated in duplicate). The error bars represent the standard deviations. The solid symbols represent organism burdens in saline-treated control mice. The hollow horizontal bars represent the duration of time that total anidulafungin concentrations remained above the MIC for the organism. The solid horizontal bars represent the duration of time that free-anidulafungin concentrations remained above the MIC for the organism.
FIG. 3.
FIG. 3.
Impact of dose fractionation on the in vivo efficacy of anidulafungin against a strain of C. albicans (left panel) and a strain of C. glabrata (right panel). Mice were treated with one of a series of five fourfold-increasing total doses of anidulafungin. The total doses were fractionated into one, two, four, or six doses over a 96-h treatment period. Each symbol represents the mean organism burden in kidneys from three mice (six kidneys, plated in duplicate). The dashed horizontal lines represent the burdens of organisms in kidneys at the start of therapy.
FIG. 4.
FIG. 4.
(a) Relationship between the anidulafungin PD indices (the Cmax/MIC ratio, the AUC0-24/MIC ratio [24 h AUC/MIC], the percentage of time that the total drug concentration exceeds the MIC [% T>MIC], and the percentage of time that the free-drug concentration exceeds the MIC [% fT>MIC]], where the level of free drug is estimated at 1%) and in vivo efficacy against a strain of C. albicans. Mice were treated with one of five total doses of anidulafungin. The total doses were fractionated into one, two, four, or six doses over a 96-h treatment period. Each symbol represents the mean organism burden in kidneys from three mice (six kidneys, plated in duplicate). The lines through the data points represent the best-fit curves. R2 is the coefficient of determination. (b) Relationship between the anidulafungin PD indices (the Cmax/MIC ratio, the AUC0-24/MIC ratio, the percentage of time that the total drug concentration exceeds the MIC, and the percentage of time that the free-drug concentration exceeds the MIC [free % T>MIC]) and in vivo efficacy against a strain of C. glabrata. Mice were treated with one of five total doses of anidulafungin. The total doses were fractionated into one, two, four, or six doses over a 96-h treatment period. Each symbol represents the mean organism burden in kidneys from three mice (six kidneys, plated in duplicate). The lines plotted through the data represent the best-fit curves. R2 is the coefficient of determination.
FIG. 5.
FIG. 5.
In vivo anidulafungin dose-response curves for multiple strains of C. albicans (5 strains; left panel) and C. glabrata (10 strains; right panel). Mice received one of a series of five fourfold-increasing doses of anidulafungin every 24 h over a 96-h treatment period. Each symbol represents the mean organism burden in the kidneys of three mice (six kidneys, plated in duplicate). The error bars represent the standard deviations. The solid horizontal lines at 0 on the y axis represent the organism burdens at the start of therapy. Symbols below the line represent organism reduction or killing over the treatment period compared to the burden at the start of therapy. Symbols above the line represent organism growth.
FIG. 6.
FIG. 6.
(a) Relationship between the anidulafungin Cmax/MIC ratio (using free-drug concentrations of 1%) and in vivo efficacy against multiple strains of C. albicans (5 strains; top panels) and C. glabrata (10 strains; bottom panels). Left panels present data obtained using total-inhibition drug MICs, and right panels present data obtained using partial-inhibition end points. Mice were treated with one of five total doses of anidulafungin. The total doses were fractionated into four doses (q24h) over a 96-h treatment period. Each symbol represents the mean organism burden in kidneys from three mice (six kidneys, plated in duplicate). The dashed horizontal lines represent the organism burdens in the kidneys at the start of therapy. The sigmoid lines represent the best-fit curves. R2 is the coefficient of determination. (b) Relationship between the anidulafungin AUC0-24/MIC ratio (using free-drug concentrations of 1%) and in vivo efficacy against multiple strains of C. albicans (5 strains; top panels) and C. glabrata (10 strains; bottom panels). Left panels present data obtained using total-inhibition drug MICs, and right panels present data obtained using partial-inhibition end points. Mice were treated with one of five total doses of anidulafungin. The total doses were fractionated into four doses (q24h) over a 96-h treatment period. Each symbol represents the mean organism burden in kidneys from three mice (six kidneys, plated in duplicate). The dashed horizontal lines represent the organism burdens in the kidneys at the start of therapy. The sigmoid lines represent the best-fit curves. R2 is the coefficient of determination.

References

    1. Ambrose, P. G., S. M. Bhavnani, C. M. Rubino, A. Louie, T. Gumbo, A. Forrest, and G. L. Drusano. 2007. Pharmacokinetics-pharmacodynamics of antimicrobial therapy: it's not just for mice anymore. Clin. Infect. Dis. 44:79-86. - PubMed
    1. Andes, D., K. Marchillo, J. Lowther, A. Bryskier, T. Stamstad, and R. Conklin. 2003. In vivo pharmacodynamics of HMR 3270, a glucan synthase inhibitor, in a murine candidiasis model. Antimicrob. Agents Chemother. 47:1187-1192. - PMC - PubMed
    1. Andes, D., and W. A. Craig. 2007. In vivo pharmacodynamic activity of the glycopeptide dalbavancin. Antimicrob. Agents Chemother. 51:1633-1642. - PMC - PubMed
    1. Andes, D., and M. I. van Ogtrop. 1999. Characterization and quantitation of the pharmacodynamics of fluconazole in a neutropenic murine disseminated candidiasis infection model. Antimicrob. Agents Chemother. 43:2116-2120. - PMC - PubMed
    1. Andes, D., and M. I. van Ogtrop. 2000. In vivo characterization of the pharmacodynamics of flucytosine in a neutropenic murine candidiasis model. Antimicrob. Agents Chemother. 44:938-942. - PMC - PubMed

Publication types

MeSH terms