Clinical Trial
. 2008 Sep;18(9):1999-2009.
doi: 10.1093/cercor/bhm224. Epub 2007 Dec 10.

The central sulcus: an observer-independent characterization of sulcal landmarks and depth asymmetry

Affiliations
Clinical Trial

The central sulcus: an observer-independent characterization of sulcal landmarks and depth asymmetry

Matthew D Cykowski et al. Cereb Cortex. 2008 Sep.

Abstract

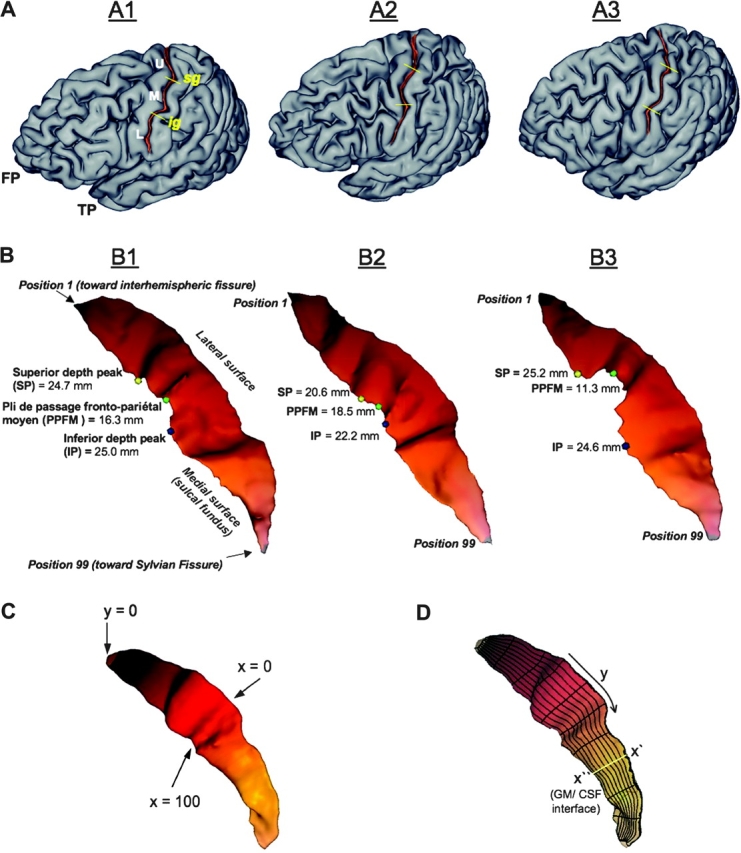
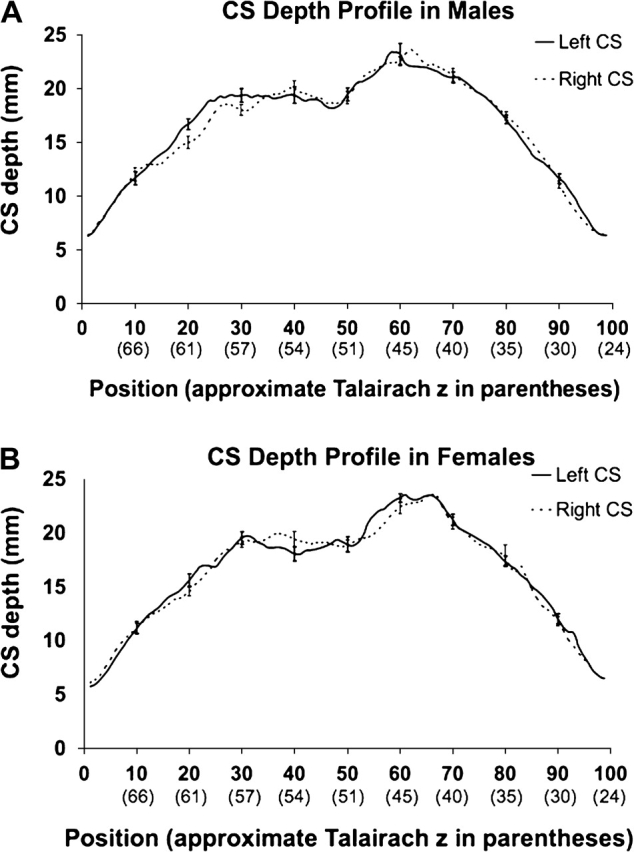
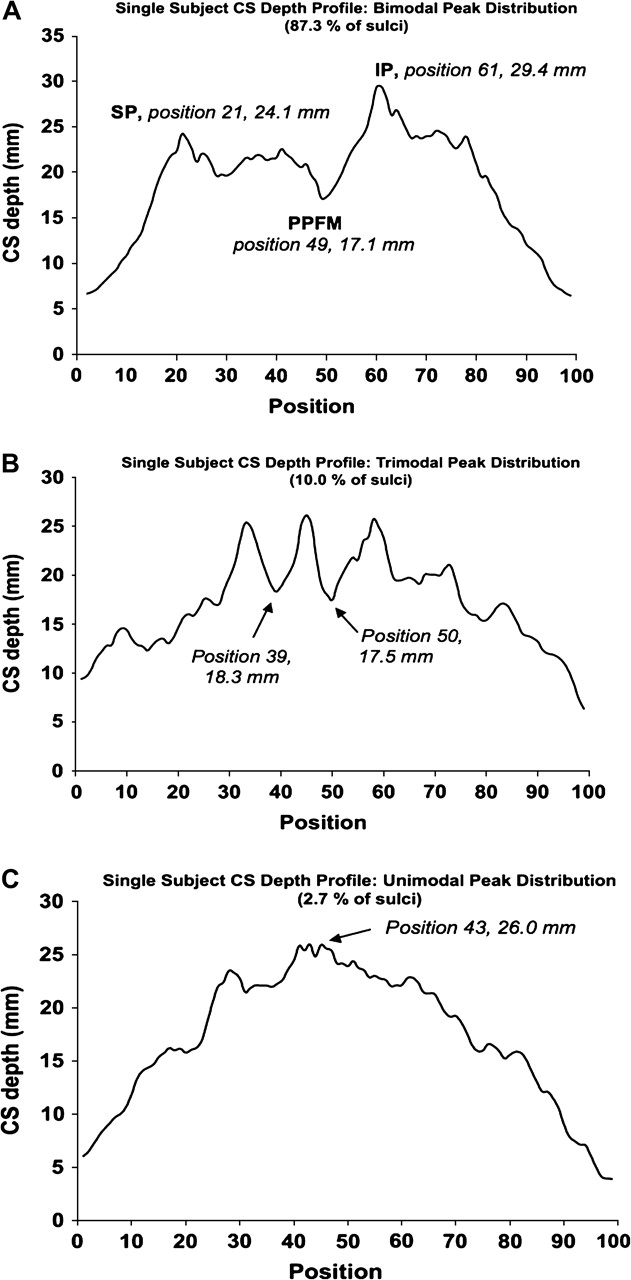
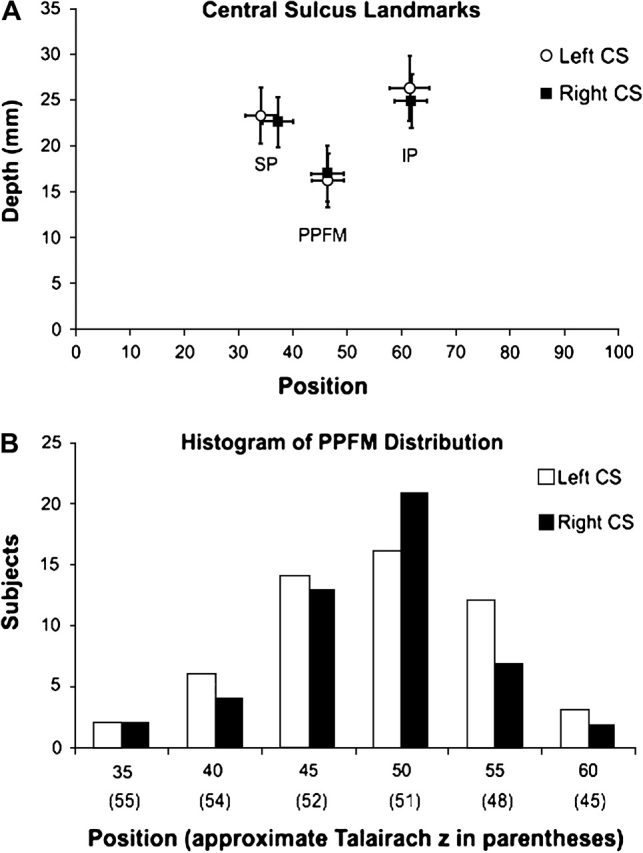
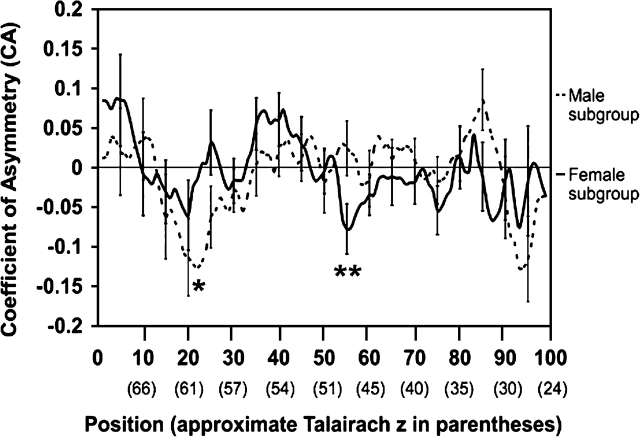
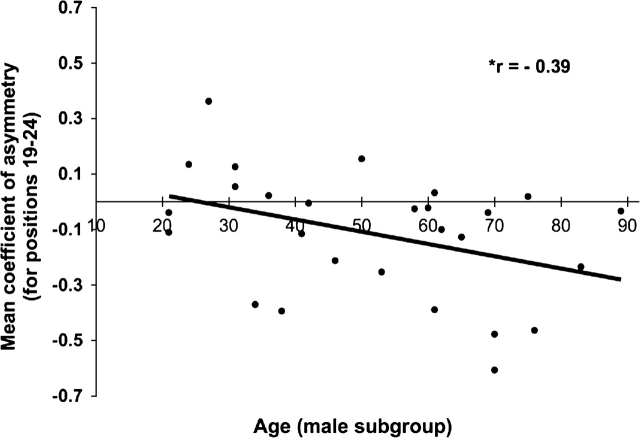
Studies of the central sulcus (CS) often use observer-dependent procedures to assess CS morphology and sulcal landmarks. Here, we applied a novel method combining automated sulcus reconstruction, surface parameterization, and an observer-independent depth measurement to study the CS. This facilitated the quantitative assessment of the spatial position and intersubject variability of several sulcal landmarks. Sulcal depth profiles also allowed us to develop an algorithm for the clear identification of several landmarks, including the pli de passage fronto-pariétal moyen (PPFM), first described by Broca. Using this algorithm, the PPFM was identified in the majority of sulci, but exhibited limited spatial variability. This appears to support Cunningham's theory that this landmark may be a developmental remnant, and may argue against its role as a guide to the more variable somatotopic hand area. Sulcal depth profiles were also utilized to assess the influence of sex, handedness, and age on CS morphology. These profiles revealed leftward depth asymmetry in the superior extent of the CS of male subjects and near the midpoint of the CS in female subjects. Age correlations were performed for these asymmetries, and a significant correlation was seen only in the male subgroup.


Figures

Figure 1.
Figure 1.
(A) Superficial appearance of the CS. Our observations agree with those of others (Symington and Crymble 1913; White et al. 1997a) that the superficial appearance of the sulcus is variable between subjects (A1; cf. A2 and A3). However, the CS of subject A1 is representative of classic descriptions (Cunningham 1892; Quain 1900; Campbell 1905). A1 demonstrates a case where the sulcus is divided into an upper (U), middle (M), and lower third (L) by 2 curves or genua (the frontal pole, FP, and temporal pole, TP, are marked for orientation). As described by Cunningham, the superior genu (SG) of the CS is “directed backward” (concave anteriorly) and the inferior genu (IG) “looks forward” (convex anteriorly) (Cunningham 1892, p. 166). Cunningham notes that the upper third (U) “inclines downwards and slightly backward,” the middle third (M) “bends suddenly forward and downward,” and the inferior third “proceeds very nearly vertically downwards” (Cunningham 1892, p. 166). The SG and IG are marked by yellow lines on 2 additional subjects to demonstrate the variability in their position. (B) Landmarks of the CS. The CS of subjects illustrated in A1–A3 have been extracted and their superior depth peak (SP, yellow circle), PPFM (green circle), and inferior depth peak (IP, blue circle) are marked. The depth is listed (in mm) next to the relevant position along the sulcus. Although several landmarks can be easily detected on visual inspection (e.g., the PPFM of B3), note that the overlaid landmarks were solely determined by applying a search algorithm to depth profiles (as demonstrated in Fig. 3 and discussed in Results). (C) Sulcal surface parameterization. A coordinate grid was generated on the surface of the sulcal mesh. (D) Depth measure. The sulcal depth profile was generated by fitting a cubic spline curve across y coordinate points sharing the same value at 99 positions along the length of the sulcus. The nonlinear-spline was fit across the sulcal mesh at each of 99 positions from the envelope of the brain (x′) to the GM/CSF interface (x″) at the sulcal fundus. An approximation of a cubic spline is indicated in (D) by the yellow line passing orthogonal to the long axis of the coordinate grid.
Figure 2.
Figure 2.
CS depth profiles in male and female subgroups. Sulcal depth profiles (±standard error bars) are shown for the male (2A) and female (2B) subgroups. Mean sulcal depth is plotted by both sulcal length position (bottom bold font). For additional reference, approximate Talairach z-coordinates are provided in parentheses below the numbered positions. It should be noted that values were aligned by position (not Talairach z-coordinate) for inter- and intrasubject comparisons (i.e., Talairach z-coordinates are for reference purposes only). Talairach coordinate points (at the sulcal fundus) are the mean z-coordinates across the entire subgroup (n = 27, male; n = 28, female) after alignment of sulci by position (see “Intersubject alignment” in Methods). Note that there is not an even spacing in both positions and Talairach z-coordinates. This is because absolute length is a function of x, y, and z. Therefore, the z-coordinate may change very slowly along contiguous positions where the sulcus bends (see Fig. 1B).
Figure 3.
Figure 3.
Patterns seen in individual sulcal depth profiles. Sulcal depth profiles of single sulci are shown that are representative of bimodal (A), trimodal (B), and unimodal (C) peak distributions. On the profile of a sulcus with a bimodal peak distribution, the superior peak (SP), PPFM, and inferior peak (IP) are labeled. A simple search algorithm determined the landmarks' position and depth (see Results for detail). The trimodal profile exemplifies a sulcus for which no PPFM was identified (2 shallow points of nearly equal depth between 3 surrounding peaks). The unimodal profile (C) was seen in only a few subjects. As our algorithm searched the 2 halves of the depth profile for distinct depth peaks, these cases were recognized as a single peak at the middle of the profile with no clear SP, IP, or PPFM.
Figure 4.
Figure 4.
Distribution of CS landmarks. (A) The position and depth of the superior peak (SP), inferior peak (IP), and PPFM are shown for the left and right CS. The SD for both position and depth measures are shown for each point. Note that between sulci, the mean SP varies slightly by position and the IP varies slightly by depth. Though an interesting trend, these differences were not significant. (B) The distribution of the PPFM for both the left and right CS. The bin of positions (e.g., 45 is the bin of positions 41–45) is shown with the approximate Talairach coordinate in parentheses below.
Figure 5.
Figure 5.
Significant findings in the CA for the male and female subgroups. CAs are plotted by position (with the approximate Talairach z-coordinate in parentheses below) as in Figure 2. Only points that were significant after correcting for multiple comparisons are noted. Significant leftward asymmetry was seen in the CA profiles at positions 18–22 (approximate Talairach z = 60–63 mm) in the group profile (not shown), positions 19–24 (approximate Talairach z = 59–62 mm) in the male subgroup (single asterisk), and positions 54–57 (approximate Talairach z = 48–50 mm) in the female subgroup (double asterisks). As noted in Figure 2, Talairach z-coordinates displayed are the mean the z-coordinate at the sulcal fundus for any particular position in the group (n = 55). CAs were determined as described in the methods (e.g., negative CA = leftward depth asymmetry).
Figure 6.
Figure 6.
Age correlation of asymmetry in the male subgroup. Post hoc correlation of significant leftward asymmetry in the male subgroup (from positions 19 to 24). The asterisk indicates a 2-tailed P value ≤ 0.05 for the correlation coefficient r. No other significant age-related trends were noted for asymmetry or mean sulcal depth.

References

    1. Alkadhi H, Crelier GR, Boendermaker SH, Golay X, Hepp-Reymond MC, Kollias SS. Reproducibility of primary motor cortex somatotopy under controlled conditions. AJNR Am J Neuroradiol. 2002;23:1524–1532. - PMC - PubMed
    1. Amunts K, Jancke L, Mohlberg H, Steinmetz H, Zilles K. Interhemispheric asymmetry of the human motor cortex related to handedness and gender. Neuropsychologia. 2000;38:304–312. - PubMed
    1. Amunts K, Schlaug G, Jancke L, Steinmetz H, Schleicher A, Dabringhaus A, Zilles K. Motor cortex and hand motor skills: structural compliance in the human brain. Hum Brain Mapp. 1997;5:206–215. - PubMed
    1. Amunts K, Schlaug G, Schleicher A, Steinmetz H, Dabringhaus A, Roland PE, Zilles K. Asymmetry in the human motor cortex and handedness. Neuroimage. 1996;4:216–222. - PubMed
    1. Bell EC, Willson MC, Wilman AH, Dave S, Silverstone PH. Males and females differ in brain activation during cognitive tasks. Neuroimage. 2006;30:529–538. - PubMed