. 2008 Jan;36(1):e1.
doi: 10.1093/nar/gkm616. Epub 2007 Dec 11.

Protein evolution by hypermutation and selection in the B cell line DT40

Affiliations

Protein evolution by hypermutation and selection in the B cell line DT40

Hiroshi Arakawa et al. Nucleic Acids Res. 2008 Jan.

Abstract

Genome-wide mutations and selection within a population are the basis of natural evolution. A similar process occurs during antibody affinity maturation when immunoglobulin genes are hypermutated and only those B cells which express antibodies of improved antigen-binding specificity are expanded. Protein evolution might be simulated in cell culture, if transgene-specific hypermutation can be combined with the selection of cells carrying beneficial mutations. Here, we describe the optimization of a GFP transgene in the B cell line DT40 by hypermutation and iterative fluorescence activated cell sorting. Artificial evolution in DT40 offers unique advantages and may be easily adapted to other transgenes, if the selection for desirable mutations is feasible.


Figures
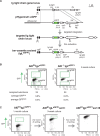
Figure 1.
Figure 1.
Strategy for artificial evolution of eGFP gene. (A) A physical map of the chicken rearranged Ig light chain locus, the pHypermut1-eGFP targeting construct and the rearranged Ig light chain locus after targeted integration and marker excision is shown. The positions of primers used for the identification of targeted integration events are shown by arrows. (B) FACS profiles of AIDR1IgLeGFP1 and AID−/−IgLeGFP1 clones. The average percentages of events falling into the GFPhigh and GFPlow gates based on the measurement of 24 subclones are shown. (C) Sorting strategy for cells of increased fluorescence activity.
Figure 2.
Figure 2.
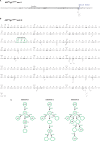
Mutations downstream and within the eGFP transgene. (A) Mutations identified at the exon/intron border of the Ig light chain leader sequence. The number of times a mutation was found is shown by superscript. (B) Mutations within the eGFP coding sequence. Mutations were mapped below the reference eGFP sequence together with the corresponding amino acid codons. The eGFP sequence which we used had one codon (Val) inserted next to the start codon to yield an optimal translation-initiation sequence (Kozak motif). This Val was numbered as codon 1a according to Crameri (26) for the easier comparison to wild-type GFP and previously reported GFP mutants. (C) Pedigrees for the evolution of the eGFP transgenes in culture. The number of times each sequence was found within each subclone is indicated at the right side of the circles. The amino acid changes of each step are shown beside the arrows. Sequences identified in more than one subclone are named v1v9.
Figure 3.
Figure 3.
Hypermutation of transgenes using pHypermut2. (A) Plasmid map of pHypermut2 vector. Target genes for artificial evolution can be cloned into the NheI, EcoRV or BglII sites. Potential gene conversion donor sequences can be cloned into the SpeI site. (B) A physical map of the rearranged Ig light chain locus, the pHypermut2-eGFP construct and the rearranged Ig light chain locus after targeted integration. The positions of primers used for the identification of targeted integration events are shown by arrows. (C) FACS profile of the ψVAIDR1IgLeGFP clone having integrated the pHypermut2-eGFP construct into the rearranged Ig light chain locus after 2 weeks culture. The average percentage of events falling into the GFPlow gate based on the measurement of 24 subclones is shown.
Figure 4.
Figure 4.
Analysis of variant GFP transfectants. (A) FACS analysis of control and variant GFP transfectants. The average fluorescence of AID London−/−IgLeGFP is indicated by a green line for easier comparison. (B) Flow chart of site-directed mutagenesis of GFP variants. (C) Relative fluorescence of the transfectants normalized to the fluorescence of AID−/−IgLeGFP. (D) Excitation and emission spectra. (E) Image of single cells by fluorescence microscopy. The image of the same single cells is shown with fluorescence activation (upper row) and without fluorescence activation (lower row).
Figure 5.
Figure 5.
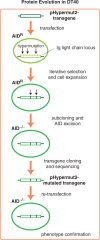
Scheme of artificial evolution in DT40. The approach only requires a cell line such as AIDR which conditionally expresses AID and the pHypermut2 targeting vector.

References

    1. Milstein C, Rada C. The maturation of the antibody response. In: Honjo T, Alt FW, editors. Immunoglobulin Genes. 2nd. London: Academic Press; 1995. pp. 57–81.
    1. Matsuura T, Yomo T. In vitro evolution of proteins. J. Biosci. Bioeng. 2006;101:449–456. - PubMed
    1. Dufner P, Jermutus L, Minter RR. Harnessing phage and ribosome display for antibody optimisation. Trends Biotechnol. 2006;24:523–529. - PubMed
    1. Dwyer MA, Looger LL, Hellinga HW. Computational design of a biologically active enzyme. Science. 2004;304:1967–1971. - PubMed
    1. Shimomura O. Structure of the chromophore of Aequorea green fluorescent protein. FEBS Lett. 1979;104:220–222.

Publication types

MeSH terms

Substances