. 2008 Feb 15;283(7):4344-51.
doi: 10.1074/jbc.M706550200. Epub 2007 Dec 11.

c-Met must translocate to the nucleus to initiate calcium signals

Affiliations

c-Met must translocate to the nucleus to initiate calcium signals

Dawidson A Gomes et al. J Biol Chem. .

Abstract

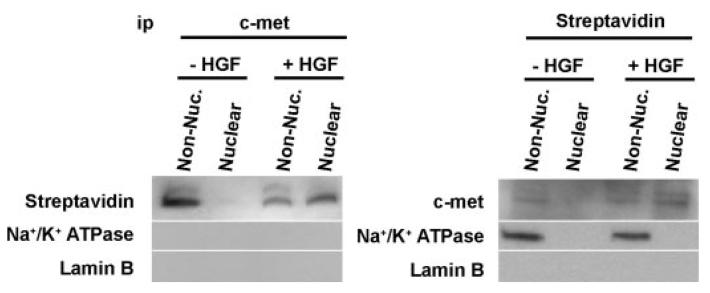
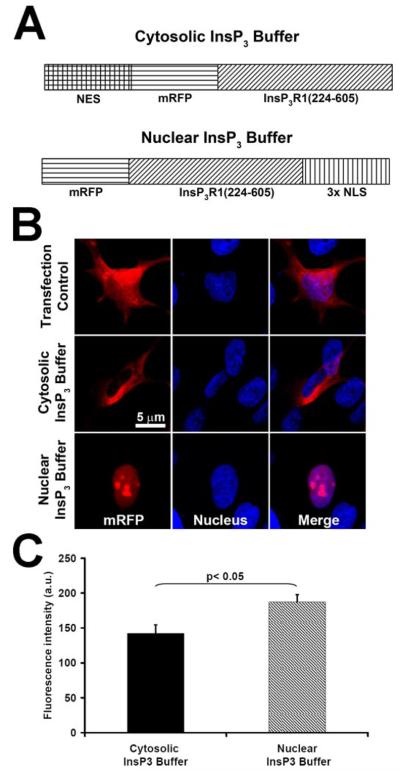
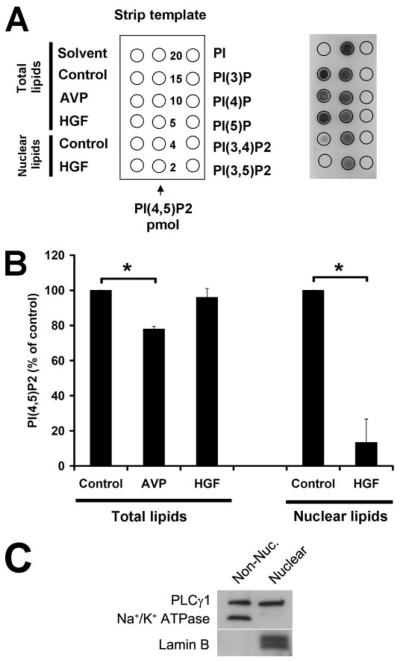
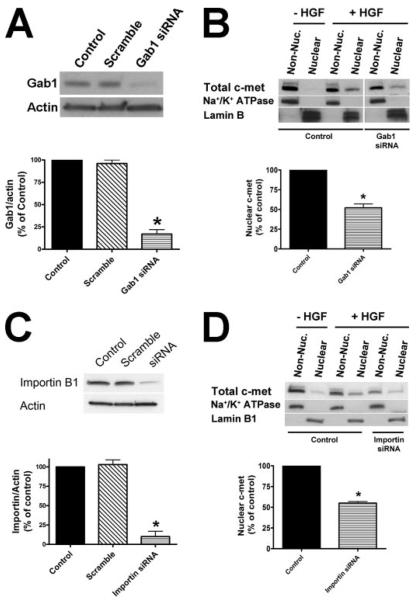
Hepatocyte growth factor (HGF) is important for cell proliferation, differentiation, and related activities. HGF acts through its receptor c-Met, which activates downstream signaling pathways. HGF binds to c-Met at the plasma membrane, where it is generally believed that c-Met signaling is initiated. Here we report that c-Met rapidly translocates to the nucleus upon stimulation with HGF. Ca(2+) signals that are induced by HGF result from phosphatidylinositol 4,5-bisphosphate hydrolysis and inositol 1,4,5-trisphosphate formation within the nucleus rather than within the cytoplasm. Translocation of c-Met to the nucleus depends upon the adaptor protein Gab1 and importin beta1, and formation of Ca(2+) signals in turn depends upon this translocation. HGF may exert its particular effects on cells because it bypasses signaling pathways in the cytoplasm to directly activate signaling pathways in the nucleus.


Figures

FIGURE 1
FIGURE 1. c-Met rapidly translocates to the nucleus
A, immunoblots of total and phosphorylated (activated) c-Met in nuclear and non-nuclear fractions of SkHep1 cells stimulated with HGF (100 ng/ml). Both total and phosphorylated receptor are absent from the nucleus at baseline but are detected in the nucleus within 1 min and reach peak intensity within 4 min of stimulation. Blots are representative of what was observed in n = 5 separate experiments. Na+/K+-ATPase and Lamin B were used as controls for the non-nuclear and nuclear fraction, respectively. C-met measurements were normalized by Na+/K+-ATPase and Lamin B levels in non-nuclear and nuclear fractions, respectively. B and C, densitometric measurement of cellular fractions of total and phosphorylated c-Met, respectively. Nuclear c-Met is maximal within 2–4 min of stimulation (n=5). D, the cytoplasmic protein α-tubulin and the nuclear protein histone 3 confirm the separation of non-nuclear (Non-Nuc.) from nuclear markers in subcellular fractions.
FIGURE 2
FIGURE 2. Confocal immunofluorescence images of c-Met before and 4 min after stimulation with HGF
A, confocal immunofluorescence images of c-Met before and 4 min after stimulation with HGF, respectively. The images confirm that the receptor moves to the nucleus. In each image, c-Met labeling is in green, and the nucleus is stained with TO-PRO-3 (blue). Serial optical sections were collected for three-dimensional reconstruction; x-z sections are shown at the top, and y-z sections are shown at the right of each image. Note that c-Met redistributes to the region of the nuclear envelope as well as in a reticular pattern within the nuclear interior (arrows). B, additional confocal immunofluorescence images of c-Met before and after stimulation with HGF. Lamin B1 staining of the nuclear envelope (red) has been added to these triple-labeled images, which confirm that the receptor moves to the nucleus.
FIGURE 3
FIGURE 3. c-Met from the plasma membrane reaches the nucleus
Biotinylated c-Met is recovered from the nucleus. c-Met at the plasma membrane was biotinylated prior to stimulation. After treatment with HGF, the non-nuclear (Non-Nuc.) and nuclear fractions were used for immunoprecipitation (ip) with either c-Met antibody or streptavidin. Both immunoprecipitations confirm that c-Met within the nucleus is labeled with streptavidin. The plasma membrane protein Na+/K+-ATPase co-precipitated with streptavidin but not c-Met, whereas the nuclear protein Lamin B did not precipitate with either streptavidin or c-Met.
FIGURE 4
FIGURE 4. Subcellular localization of targeted InsP3 buffer fusion proteins
A, schematic representation of mRFP-targeted InsP3 buffer fusion proteins. NES, nuclear exclusion signal; NLS, nuclear localization signal. B, targeted InsP3 buffer constructs localize correctly to the cytoplasm or nucleus. SkHep1 cells were transiently transfected with either the cytosolic or the nuclear InsP3 buffer construct or else with mRFP alone as a transfection control. Cells were labeled with the nuclear marker TO-PRO-3 (blue) to confirm nuclear localization or exclusion. C, RFP fluorescence is slightly but significantly greater in cells expressing the nuclear InsP3 buffer. Values are mean ± S.E. of measurements made from 30 cells in each group. a.u., arbitrary units.
FIGURE 5
FIGURE 5. c-Met generates InsP3 in the nucleus rather than the cytoplasm
A, vasopressin-induced Ca2+ signals are blocked by the cytosolic but not the nuclear InsP3 buffer. Cells were loaded with fluo-4 and then stimulated with 100 nm AVP while examined by confocal microscopy. The red box indicates the region of interest in the nucleus, and the white box represents the region of interest in the cytoplasm that was used to monitor Ca2+ signals. min., minimum; max., maximum. B, graphical representation of the nuclear and cytosolic Ca2+ signal detected in a representative cell from each experimental group stimulated with vasopressin. The tracings confirm that the cytosolic but not the nuclear InsP3 buffer blocks all Ca2+ signaling. C, HGF-induced Ca2+ signals are blocked by the nuclear but not the cytosolic InsP3 buffer. Cells were stimulated with HGF (100 ng/ml) while examined by confocal microscopy. The red box indicates the region of interest in the nucleus, and the white box represents the region of interest in the cytoplasm that was used to monitor Ca2+ signals. D, graphical representation of the nuclear and cytosolic Ca2+ signal detected in a representative cell from each experimental group stimulated with HGF. The tracings confirm that the nuclear but not the cytosolic InsP3 buffer blocks all Ca2+ signaling. E, summary of InsP3 buffer studies confirms that AVP Ca2+ signaling depends upon cytosolic InsP3, whereas HGF Ca2+ signaling depends upon nuclear InsP3. Values are mean ± S.E. of the peak fluo-4 fluorescence attained during the observation period (expressed as % of baseline) and include the response from 10–15 cells in each experimental group (*, p < 0.05). F, cytoplasmic and nuclear Ca2+ signals in representative cells examined at a rate of 83 ms/image. The vasopressin-induced Ca2+ signal begins in the cytoplasm, whereas the HGF-induced signal begins in the nucleus. Note the expanded time scales; each agonist was added at t = 0.
FIGURE 6
FIGURE 6. HGF hydrolyzes nuclear PIP2
A, lipid samples were spotted onto nitrocellulose membranes (right), as illustrated by the strip template (left), and the PIP2 levels were detected using an anti-PIP2 monoclonal antibody that reacts with PIP2 with a high degree of specificity. Left column, experimental samples; middle column, PIP2 standards; right column, PIP controls (20 pmol each). PI(3)P, phosphatidylinositol-3-phosphate; PI(4)P, phosphatidylinositol 4-phosphate; PI(5)P, phosphatidylinositol 5-phosphate; PI(3,4)P2, phosphatidylinositol 3,4-bisphosphate; PI(3,5)P2, phosphatidylinositol 3,5-bisphosphate; and PI(4,5)P2, phosphatidylinositol 4,5-bisphosphate. B, densitometric measurement shows that AVP hydrolyzes 22 ± 2% of PIP2 in whole cell preparations (n = 3, *, p < 0.05), whereas HGF stimulation does not hydrolyze significant amounts of PIP2 in such preparations. However, upon HGF stimulation, PIP2 levels in the nucleus are decreased by 87 ± 13% (n = 3, *, p < 0.05). Total lipids and nuclear lipids were isolated 4 min after stimulation with HGF (100 ng/ml) or 30 s after stimulation with AVP (100 nm). Values mean ± S.E. C, phospholipase C-γ1 is found in both the cytoplasm and the nucleus of SkHep1 cells. Non-Nuc., non-nuclear.
FIGURE 7
FIGURE 7. Gab1 translocates to the nucleus upon HGF stimulation
A, immunoblots of Gab1 in nuclear and non-nuclear (Non-Nuc.) fractions of SkHep1 cells before and after stimulation with HGF (100 ng/ml) demonstrate that HGF induces Gab1 to shift to the nucleus. Na+/K+-ATPase and Lamin B were used as controls for the non-nuclear and nuclear fraction, respectively. B, the graphical representation confirms that Gab1 rapidly shifts to the nucleus after stimulation with HGF. Values are scaled relative to the initial amount in the non-nuclear fraction (mean ± S.E.; n = 3).
FIGURE 8
FIGURE 8. Gab1 and importin β1 are required for c-Met translocation
A, an siRNA construct specifically reduces expression of Gab1 in SkHep1 cells. Cells were transfected with 50 nm siRNA for Gab or a scrambled siRNA control. Densitometric analysis confirms that the Gab1 siRNA reduces protein expression by 83 ± 6% (n = 4, *, p < 0.001). B, immunoblots of total c-Met in nuclear and non-nuclear (Non-Nuc.) fractions of SkHep1 cells stimulated with HGF show that Gab1 siRNA reduces translocation of c-Met to the nucleus. Densitometry confirms that the amount of c-Met in the nucleus in siRNA-treated cells is reduced by 48 ± 5% (n = 3; *, p < 0.05). C, an siRNA construct specifically reduces expression of importin β1 in SkHep1 cells. Cells were transfected with 50 nm siRNA for importin β1 or a scrambled siRNA control. Densitometric analysis confirms that the importin siRNA reduces protein expression by 90 ± 7% (n = 3, *, p < 0.001). D, immunoblots of total c-Met in nuclear and non-nuclear fractions of SkHep1 cells stimulated with HGF show that importin β1 siRNAs reduces translocation of c-Met to the nucleus. Densitometry confirms that the amount of c-Met in the nucleus in siRNA-treated cells is reduced by 55% ± 2% (n = 3; *, p < 0.05).
FIGURE 9
FIGURE 9. c-Met must translocate to the nucleus to generate Ca2+ signals
A, HGF-induced Ca2+ signals are blocked by reduced expression of Gab1 or importinβ1. Cells were stimulated with HGF (100 ng/ml) while examined by confocal microscopy. The red box indicates the region of interest in the nucleus, and the white box represents the region of interest in the cytoplasm that was used to monitor Ca2+ signals. min., minimum; max., maximum. B, graphical representation of the nuclear and cytosolic Ca2+ signal detected in a representative non-transfected cell and in cells transfected with Gab-1 or importin siRNA. Each cell was stimulated with HGF and then with AVP. Note that reduced expression of Gab-1 or importin β1 blocks the response to HGF but does not impair the response to vasopressin. C, a summary of Gab1 and importin studies confirms that HGF Ca2+ signaling is eliminated in cells treated with siRNA for either Gab1 or importinβ1. Values are mean ± S.E. of the peak fluo-4 fluorescence (expressed as % of baseline) and include the response from 15–35 cells in each experimental group (*, p < 0.05).
FIGURE 10
FIGURE 10. c-Met Ca2+ signaling within the nucleus
Stimulation with HGF induces c-Met to translocate to the nucleus, and this depends upon importin β and the adaptor protein Gab1. In the nucleus, activated c-Met forms InsP3 (although the topology of c-Met in the nucleus, and whether HGF remains bound to nuclear c-Met, are unknown). This acts on nuclear InsP3 receptors to increase free nucleoplasmic Ca2+. In contrast, vasopressin induces the V1a receptor to form InsP3 in the region of the plasma membrane, which acts on InsP3 receptors in the endoplasmic reticulum to increase free Ca2+ in the cytoplasm.

References

    1. Maher JJ. J. Clin. Investig. 1993;91:2244–2252. - PMC - PubMed
    1. Michalopoulos GK, DeFrances MC. Science. 1997;276:60–66. - PubMed
    1. Furge KA, Zhang YW, Vande Woude GF. Oncogene. 2000;19:5582–5589. - PubMed
    1. Shiota G, Rhoads DB, Wang TC, Nakamura T, Schmidt EV. Proc. Natl. Acad. Sci. U. S. A. 1992;89:373–377. - PMC - PubMed
    1. Okano Y, Mizuno K, Osada S, Nakamura T, Nozawa Y. Biochem. Biophys. Res. Commun. 1993;190:842–848. - PubMed

Publication types

Substances