. 2008 Feb;14(2):284-96.
doi: 10.1261/rna.725208. Epub 2007 Dec 11.

Diverse roles of hnRNP L in mammalian mRNA processing: a combined microarray and RNAi analysis

Affiliations

Diverse roles of hnRNP L in mammalian mRNA processing: a combined microarray and RNAi analysis

Lee-Hsueh Hung et al. RNA. 2008 Feb.

Abstract

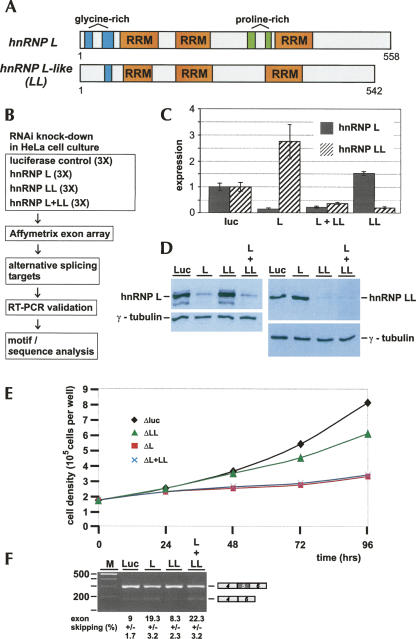
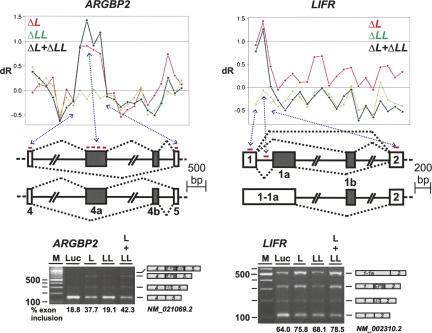
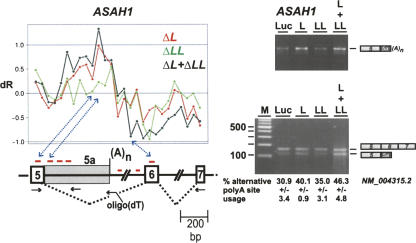
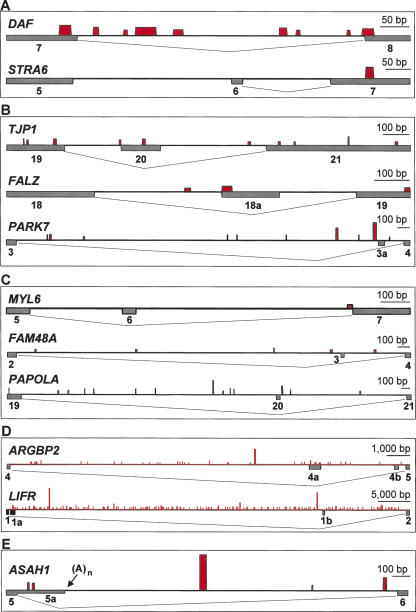
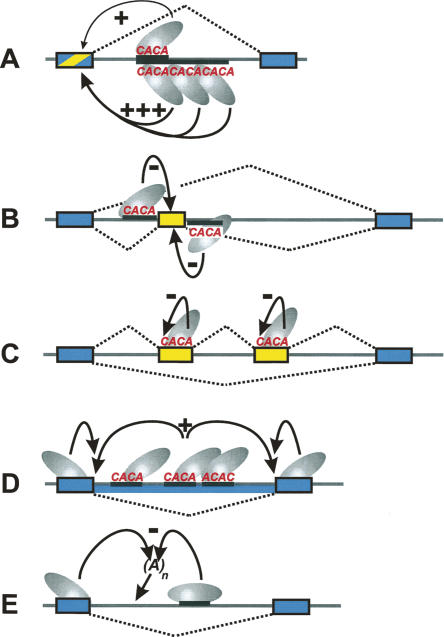
Alternative mRNA splicing patterns are determined by the combinatorial control of regulator proteins and their target RNA sequences. We have recently characterized human hnRNP L as a global regulator of alternative splicing, binding to diverse C/A-rich elements. To systematically identify hnRNP L target genes on a genome-wide level, we have combined splice-sensitive microarray analysis and an RNAi-knockdown approach. As a result, we describe 11 target genes of hnRNP L that were validated by RT-PCR and that represent several new modes of hnRNP L-dependent splicing regulation, involving both activator and repressor functions: first, intron retention; second, inclusion or skipping of cassette-type exons; third, suppression of multiple exons; and fourth, alternative poly(A) site selection. In sum, this approach revealed a surprising diversity of splicing-regulatory processes as well as poly(A) site selection in which hnRNP L is involved.


Figures

FIGURE 1.
FIGURE 1.
Genome-wide search for hnRNP L-regulated alternative splicing targets: combined microarray/RNAi strategy. (A) hnRNP L and LL, two closely related RNA-binding proteins. The domain structures of hnRNP L (P14866; 558 amino acids) and LL (Q53T80; 542 amino acids) are schematically represented (three canonical RRM motifs as orange boxes; glycine- and proline-rich regions in blue and green, respectively). (B) Outline of microarray/RNAi strategy. (C,D) RNAi knockdown of hnRNP L and LL: validation by (C) quantitative RT-PCR and (D) Western blotting. HeLa cells were treated with siRNA oligonucleotides specific for hnRNP L, LL, both L and LL, or as a control, luciferase mRNAs. (C) Relative mRNA levels are diagrammed (filled bars, hnRNP L; striped bars, hnRNP LL), normalized to luciferase. (D) Lysates were prepared after knockdowns (as indicated above the lanes), and hnRNP L (left panel), hnRNP LL (right panel), and as internal standard, γ-tubulin (lower panels) were detected by Western blotting. (E) Growth curves of HeLa cell cultures after RNAi knockdown of hnRNP L, LL, and L/LL double knockdown. HeLa cell cultures were treated with siRNA oligonucleotides specific for hnRNP L (ΔL; red squares), hnRNP LL (ΔLL; green triangles), or both L and LL (ΔL + ΔLL; blue crosses); luciferase knockdown served as a control (Δluc; black diamonds). After 24, 48, 72, and 96 h, cell densities were measured. (F) Alternative splicing of endogenous GSTZ1 mRNA. Total RNA was prepared after knockdown in HeLa cells (as indicated above the lanes), and alternative splicing of endogenous GSTZ1 mRNA (exon 5 skipping, as schematically shown on the right) was assayed by semiquantitative RT-PCR; exon skipping is quantitated as a percentage below. (M) DNA size markers (DNA ladder mix; Fermentas).
FIGURE 2.
FIGURE 2.
Quantitation of hnRNP L and LL protein levels. (A,B) Cytoplasmic (lanes S100) and nuclear (lanes NE) extracts were prepared from HeLa cells (Lee et al. 1988), and 12.5 μg of total protein from each extract was subjected to Western blot analysis, with γ-tubulin Western signals serving as an internal standard. Signals were quantitated by comparing with Western signals obtained with recombinant His-tagged hnRNP L/LL proteins (5, 10, 30, 50, or 100 ng of either protein, as indicated above the lanes). (A) hnRNP L was detected by monoclonal antibody 4D11, (B) hnRNP LL by our own antibody (see Materials and Methods). To visualize the less abundant hnRNP LL in B, two different exposures are shown (overexposure at the bottom). The electrophoretic positions of His-tagged hnRNP L, -LL, and of γ-tubulin are marked on the sides.
FIGURE 3.
FIGURE 3.
Combined microarray/RNAi approach: Detection and validation of intron retention cases. Detection of intron retention targets (upper panels). The diagrams show log2 ratios of probe-set signal intensities from the microarray data across the DAF gene, each relative to the luciferase control values. For each probe set (X-axis), three values are given (Y-axis: ΔL, knockdown of hnRNP L, in red; ΔLL, knockdown of hnRNP LL, in green; ΔL + ΔLL, knockdown of both hnRNP L and LL, in black). Probe-set positions in the retained intron and flanking regions are shown below. RT-PCR validation of intron retention in DAF (NM_000574.2) and STRA6 (NM_022369.2) genes (lower panels). Total RNA was prepared after knockdown in HeLa cells (as indicated above the lanes), and alternative splicing of endogenous DAF and STRA6 mRNAs was measured by RT-PCR. The percentages of intron retention are listed with standard deviations (n = 3) below the corresponding lanes. (M) DNA size markers (DNA ladder mix; Fermentas).
FIGURE 4.
FIGURE 4.
Exon skipping and inclusion. Target detection in TJP1 (NM_003257.2), FALZ (NM_004459.5), PARK7 (NM_007262.3), MYL6 (NM_021019.2), FAM48A (NM_017569.2), and PAPOLA (NM_032632.3) mRNAs (upper panels; legends for X- and Y-axes as in Fig. 3). For each gene, probe-set positions in the cassette exon and its flanking regions are shown below. In case of FAM48A, the other probe set with a significant low dR value was filtered out, because its P-value was too high. (Lower panels) RT-PCR validation. Total RNA was prepared after knockdown in HeLa cells (as indicated above the lanes), and alternative splicing of the six endogenous genes assayed by RT-PCR. Note that for TJP1 the additional minor band (asterisk) above the lower band represents an RT-PCR product due to mispriming within exon 20 (data not shown). The percentages of exon inclusion are listed with standard deviations (n = 3) below the corresponding lanes. (M) DNA size markers (DNA ladder mix; Fermentas).
FIGURE 5.
FIGURE 5.
Suppression of multiple exons. Target detection in ARGBP2 (NM_021069.2) and LIFR mRNAs (NM_002310.2) (upper panels; legends for X- and Y-axes as in Fig. 3). Probe-set positions in the long intron and its flanking regions, as well alternative splicing patterns of ARGBP2 and LIFR mRNAs are shown below. (Lower panels) RT-PCR validation. Total RNA was prepared after knockdown in HeLa cells (as indicated above the lanes), and alternative splicing of endogenous ARGBP2 and LIFR mRNAs was assayed by RT-PCR. The identities of the RT-PCR products (as determined by sequence analysis) are diagrammed on the right. In each case, the percentages of exon inclusion (all internal exons combined) are listed below the corresponding lanes. (M) DNA size markers (DNA ladder mix; Fermentas).
FIGURE 6.
FIGURE 6.
Alternative poly(A) site selection. Target detection of alternative polyadenylation in ASAH1 (NM_004315.2) (left panel; legends for X- and Y-axes as in Fig. 3). Probe-set positions in exon 5, intron 6, and exon 6 region of ASAH1 mRNA are shown below, together with positions and directions of the primers used [three gene-specific primers by arrows; oligo(dT) primer]. RT-PCR validation (right panels). Total RNA was prepared after knockdown in HeLa cells (as indicated above the lanes), and splicing/alternative polyadenylation of endogenous ASAH1 mRNA was assayed by RT-PCR. (Upper gel photo) oligo(dT) primer combined with exon 5 forward primer, reflecting use of internal poly(A) site. (Lower gel photo) Combination of three gene-specific primers as shown on the left, resulting in two products that reflect spliced mRNA and internally polyadenylated mRNA (as indicated on the side). The percentages of internal polyadenylation are given below the corresponding lanes (signal of lower band compared to the sum of both bands; with standard deviations, n = 3; since different reverse primers are used, these values do not yield absolute numbers on the mRNA variants but allow the comparison between the control and knockdown samples). (M) DNA size markers (DNA ladder mix; Fermentas).
FIGURE 7.
FIGURE 7.
Map of hnRNP L-binding motifs in the target regions. For each gene, the exon/intron structure is represented by lines and gray boxes below the lines; the red bars above the lines indicate positions of hnRNP L-binding motifs (the width of the bar corresponding to the length of the motifs, the height to their scores; for a description how scores were derived, see Materials and Methods; for sequences of binding motifs, see Table 1). Note that the scale differs for the various gene regions (as indicated). (A) DAF and STRA6, where hnRNP L functions as an activator and is required for efficient intron splicing. (B) TJP1, FALZ, and PARK7, where hnRNP L represses a regulated exon. (C) MYL6, FAM48A, and PAPOLA, where hnRNP L activates a regulated exon. (D) ARGBP2 and LIFR, where hnRNP L represses use of multiple exons. (E) ASAH1, where hnRNP L regulates selection of an internal poly(A) site (position indicated by arrow).
FIGURE 8.
FIGURE 8.
Summary of hnRNP L activities in regulation of alternative splicing. The following regulatory activities of hnRNP L are schematically represented, with hnRNP L functioning as an activator (+) or repressor (−), and using intronic or exonic C/A-rich elements (constitutive exons as blue boxes, regulated exons in yellow). Examples for each of these models were found in this study; additional examples are cited. (D,E) Some of these mechanisms are hypothetical, in particular, whether intronic and/or exonic elements are involved in intron retention and internal polyadenylation (see Discussion for details). (A) Determining splicing efficiency of an intron or activating inclusion of an alternative exon (hnRNP L as activator; intronic C/A-rich enhancer, sometimes in a length-dependent manner) (Hui et al. 2003a; Cheli and Kunicki 2006). (B) Skipping of cassette-type exons (hnRNP L repressor, in combination with intronic C/A-rich silencer sequences either downstream or upstream of the regulated exon) (Hui et al. 2005); (C) suppression of (multiple) alternative exons/regulation of variable exons (hnRNP L repressor; exonic silencer elements) (House and Lynch 2006); (D) intron retention (hnRNP L activator; intronic or exonic hnRNP L motifs may be involved). (E) Alternative internal polyadenylation (hnRNP L repressor; intronic or exonic hnRNP L motifs may be involved).

Similar articles

Cited by

References

    1. Ast, G. How did alternative splicing evolve? Nat. Rev. Genet. 2004;5:773–782. - PubMed
    1. Bell, M., Schreiner, S., Damianov, A., Reddy, R., Bindereif, A. p110, a novel human U6 snRNP protein and U4/U6 snRNP recycling factor. EMBO J. 2002;21:2724–2735. - PMC - PubMed
    1. Bilbao, D., Valcarcel, J. Getting to the heart of a splicing enhancer. Nat. Struct. Biol. 2003;10:6–7. - PubMed
    1. Black, D.L. Mechanisms of alternative pre-messenger RNA splicing. Annu. Rev. Biochem. 2003;72:291–336. - PubMed
    1. Blanchette, M., Green, R.E., Brenner, S.E., Rio, D.C. Global analysis of positive and negative pre-mRNA splicing regulators in Drosophila . Genes & Dev. 2005;19:1306–1314. - PMC - PubMed

Publication types

MeSH terms

Substances