. 2007 Dec;177(4):2083-99.
doi: 10.1534/genetics.107.080226.

Genomewide spatial correspondence between nonsynonymous divergence and neutral polymorphism reveals extensive adaptation in Drosophila

Affiliations

Genomewide spatial correspondence between nonsynonymous divergence and neutral polymorphism reveals extensive adaptation in Drosophila

J Michael Macpherson et al. Genetics. 2007 Dec.

Abstract

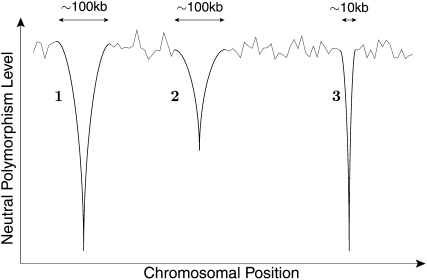
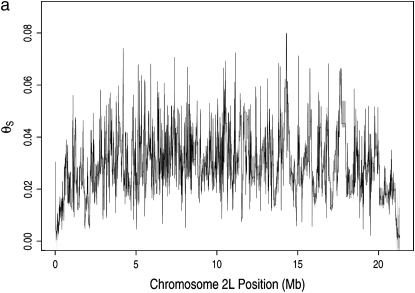
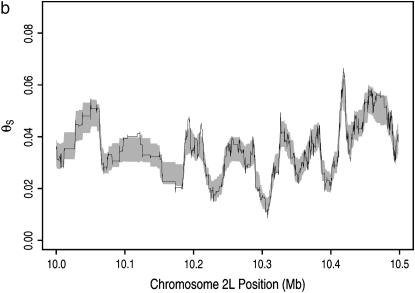
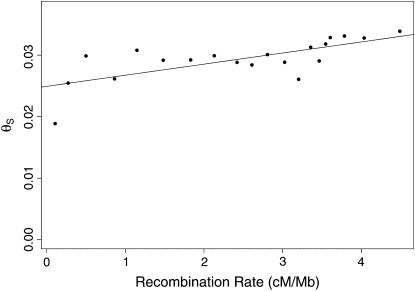
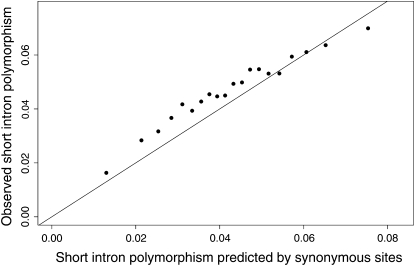
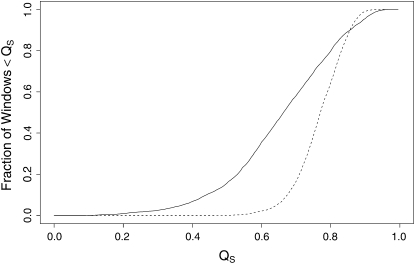
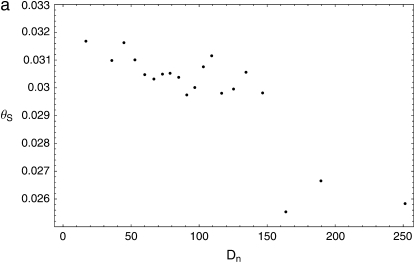
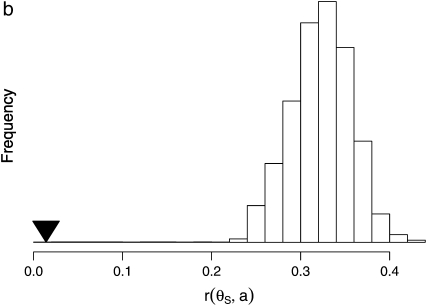
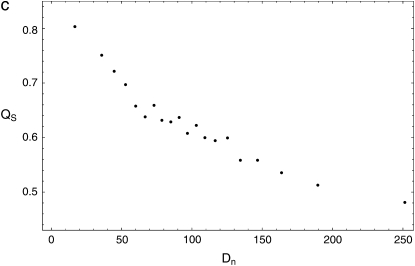
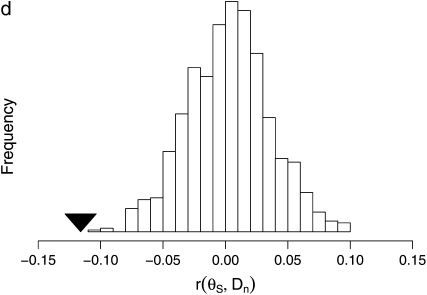
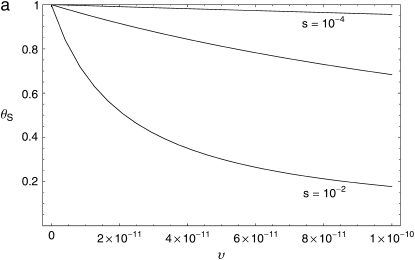
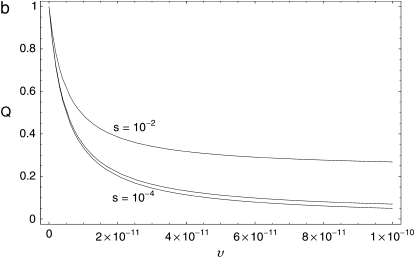
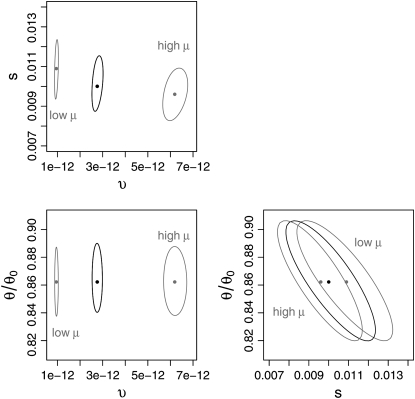
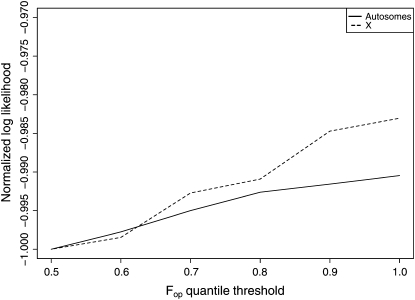
The effect of recurrent selective sweeps is a spatially heterogeneous reduction in neutral polymorphism throughout the genome. The pattern of reduction depends on the selective advantage and recurrence rate of the sweeps. Because many adaptive substitutions responsible for these sweeps also contribute to nonsynonymous divergence, the spatial distribution of nonsynonymous divergence also reflects the distribution of adaptive substitutions. Thus, the spatial correspondence between neutral polymorphism and nonsynonymous divergence may be especially informative about the process of adaptation. Here we study this correspondence using genomewide polymorphism data from Drosophila simulans and the divergence between D. simulans and D. melanogaster. Focusing on highly recombining portions of the autosomes, at a spatial scale appropriate to the study of selective sweeps, we find that neutral polymorphism is both lower and, as measured by a new statistic Q(S), less homogeneous where nonsynonymous divergence is higher and that the spatial structure of this correlation is best explained by the action of strong recurrent selective sweeps. We introduce a method to infer, from the spatial correspondence between polymorphism and divergence, the rate and selective strength of adaptation. Our results independently confirm a high rate of adaptive substitution (approximately 1/3000 generations) and newly suggest that many adaptations are of surprisingly great selective effect (approximately 1%), reducing the effective population size by approximately 15% even in highly recombining regions of the genome.


Figures

F<sc>igure</sc> 1.—
Figure 1.—
An illustration of the spatial effect of recurrent selective sweeps on the level of neutral polymorphism. The effects of three sweeps are shown on the background of the polymorphism level generated by mutation and random genetic drift. Sweeps 1 and 2 are of similarly strong selective advantage, but sweep 1 has taken place much more recently than sweep 2. Like sweep 1, sweep 3 has taken place recently, but is of lesser selective advantage.
F<sc>igure</sc> 2.—
Figure 2.—
Map of neutral polymorphism estimated from data at synonymous sites. The map was calculated in units of segregating sites in a sample of size 4 per unit synonymous mutational opportunity and translated into the familiar units of θS (materials and methods). (a) Neutral polymorphism map (solid line) along chromosome arm 2L. Edges of bootstrap sleeve (shaded) are one standard deviation away from bootstrap mean; 1000 replicates are shown. (b) Same as in a, but for a 500-kb region near the center of arm 2L.
F<sc>igure</sc> 3.—
Figure 3.—
Comparison of recombination map with neutral polymorphism map across pooled autosomes. We pooled the estimates to reduce sampling error: the lists of codons were ordered by recombination rate and then grouped into pools of approximately the same total synonymous mutational opportunity. The recombination rate (x-axis) and polymorphism (y-axis) of each pool were calculated as averages across codons, where each codon was weighted according to its synonymous mutational opportunity.
F<sc>igure</sc> 4.—
Figure 4.—
Relationship between the level of polymorphism observed at short introns and predicted by the map based on synonymous polymorphism. To reduce sampling noise, the data were grouped by predicted polymorphism into 20 pools of similar intronic mutational opportunity.
F<sc>igure</sc> 5.—
Figure 5.—
Comparison of observed spatial heterogeneity in polymorphism to neutral simulations. QS was evaluated on a set of windows produced by sliding a 100-kb window along the highly recombining autosomal regions by steps of 600 bp; to reduce sampling noise, we discarded any window with total synonymous mutational opportunity <1000. This procedure was applied to both the data and the neutral simulations described in the text. For a given value of QS, say x, along the abscissa, the ordinal value is the fraction of windows in which QS exceeded x. The solid curve corresponds to the data, and the dashed curve to the neutral simulations.
F<sc>igure</sc> 6.—
Figure 6.—
Observed relationships between proxies for the rate of adaptation and neutral polymorphism. All measures were computed over the set of 100-kb windows described in the text. (a) The relationship between the number of nonsynonymous divergences, Dn, and the average neutral polymorphism, θS. The set of windows is grouped by Dn into 20 pools of similar nonsynonymous mutational opportunity to reduce sampling noise. (b) Relationship between observed value of the correlation between the McDonald–Kreitman estimate of the number of adaptations, a = Dn − (Ds/Ps)Pn (Mcdonald and Kreitman 1991; Smith and Eyre-Walker 2002), and θS, and the null distribution of this correlation obtained by permutation, based on 1000 replicates. (c) The relationship between Dn and the homogeneity in polymorphism, QS. The set of windows has been grouped into 20 pools by Dn as in a. (d) Relationship between observed value of the correlation between Dn and θS and the null distribution of this correlation obtained by shuffling in 5-kb segments, based on 1000 replicates.
F<sc>igure</sc> 7.—
Figure 7.—
Theoretical relationships between neutral polymorphism statistics and the rate and strength of adaptation. The range of rates, υ = 10−11–10−10 bp−1 gen−1, the recombination rate, c = 3 × 10⁻⁸ bp−1 gen−1, and the population size, N = 106, were drawn from the recent Drosophila literature (Andolfatto and Przeworski 2000; Smith and Eyre-Walker 2002; Andolfatto 2005). Curves are plotted for three values of the selective coefficient, s = 10−2, 10−3, 10−4. (a) Dependence of the average level of neutral polymorphism, θS, expressed as the ratio of its value to the neutral expectation, on the rate, υ. (b) Dependence of Qs on υ.
F<sc>igure</sc> 8.—
Figure 8.—
Confidence regions about point estimates of mean adaptation rate and strength, and reduction in neutral polymorphism, for several neutral mutation rate values. The approximate 95% confidence surface, which is based on the inference procedure described in materials and methods, is displayed as three cross-sections. In each cross-section one parameter is held fixed at its inferred value while the other two are varied. The region corresponding to the mean neutral mutation rate μ = 5.8 × 10⁻⁹ bp−1 gen−1 estimated by Haag-Liautard et al. (2007) is indicated as solid lines. The lower and upper 95% neutral mutation rate estimates from the same article, respectively μ = 2.0 × 10⁻⁹ bp−1 gen−1 and μ = 1.3 × 10⁻⁸ bp−1 gen−1, are shaded and labeled accordingly. The respective point estimates are plotted as dots near the center of each respective region. The point estimates themselves, for the mean, low, and high neutral mutation rates, respectively, are (υ, s, θ/θ0) = (2.8 × 10⁻¹², 0.010, 0.86), (0.95 × 10⁻¹², 0.011, 0.86), and (6.2 × 10⁻¹², 0.0096, 0.86).
F<sc>igure</sc> A1.—
Figure A1.—
Log likelihood of polymorphism estimates from synonymous sites at short introns as a function of Fop quantile threshold. Curves for the autosomes (solid) and X chromosome (dashed) are shown. The X and autosomes are analyzed separately because of the different behavior of fp, fd, and codon usage bias on the X and autosomes Singh et al. (2005b). The autosomal log-likelihood values have each been divided by 49,016.8, and the X chromosomal log-likelihood values have each been divided by 5581.2 to allow the curves to appear on the same scale.

References

    1. Akashi, H., and A. Eyre-Walker, 1998. Translational selection and molecular evolution. Curr. Opin. Genet. Dev. 8 688–693. - PubMed
    1. Aminetzach, Y. T., J. M. Macpherson and D. A. Petrov, 2005. Pesticide resistance via transposition-mediated adaptive gene truncation in Drosophila. Science 309 764–767. - PubMed
    1. Andolfatto, P., 2005. Adaptive evolution of non-coding DNA in Drosophila. Nature 437 1149–1152. - PubMed
    1. Andolfatto, P., and M. Przeworski, 2000. A genome-wide departure from the standard neutral model in natural populations of Drosophila. Genetics 156 257–268. - PMC - PubMed
    1. Bates, D. M., and D. G. Watts, 1988. Nonlinear Regression Analysis and Its Applications. Wiley, New York.

Publication types

LinkOut - more resources