. 2007 Dec 12;2(12):e1296.
doi: 10.1371/journal.pone.0001296.

Global patterns in seasonal activity of influenza A/H3N2, A/H1N1, and B from 1997 to 2005: viral coexistence and latitudinal gradients

Affiliations

Global patterns in seasonal activity of influenza A/H3N2, A/H1N1, and B from 1997 to 2005: viral coexistence and latitudinal gradients

Brian S Finkelman et al. PLoS One. .

Abstract

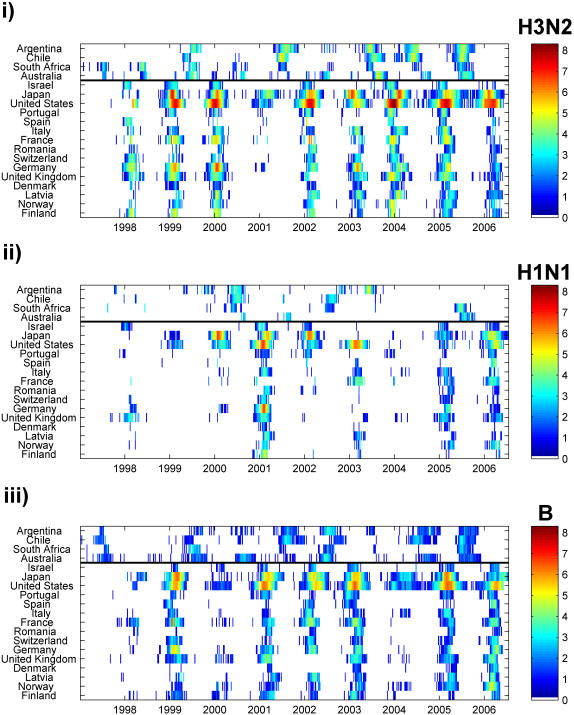
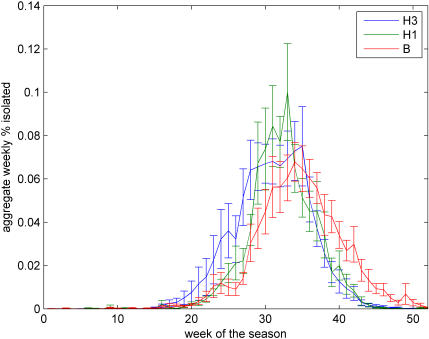
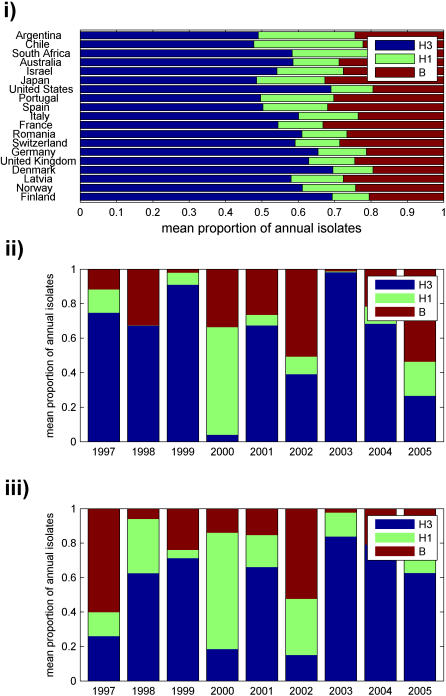
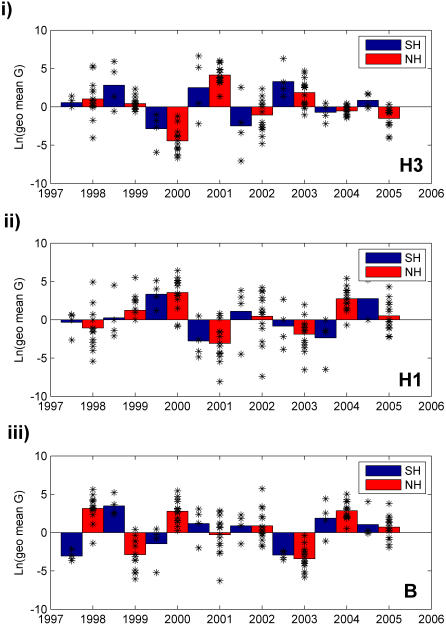
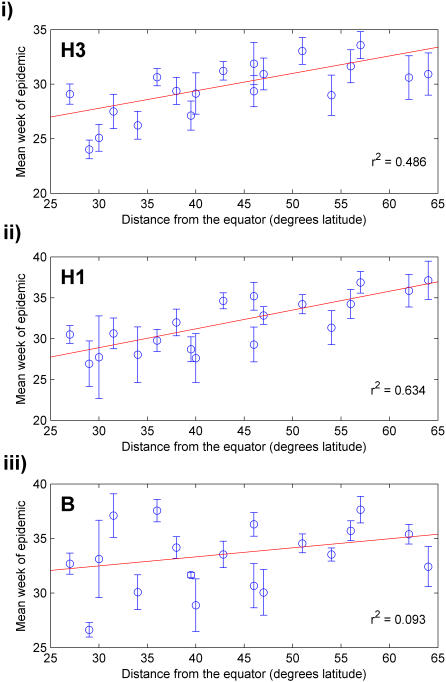
Despite a mass of research on the epidemiology of seasonal influenza, overall patterns of infection have not been fully described on broad geographic scales and for specific types and subtypes of the influenza virus. Here we provide a descriptive analysis of laboratory-confirmed influenza surveillance data by type and subtype (A/H3N2, A/H1N1, and B) for 19 temperate countries in the Northern and Southern hemispheres from 1997 to 2005, compiled from a public database maintained by WHO (FluNet). Key findings include patterns of large scale co-occurrence of influenza type A and B, interhemispheric synchrony for subtype A/H3N2, and latitudinal gradients in epidemic timing for type A. These findings highlight the need for more countries to conduct year-round viral surveillance and report reliable incidence data at the type and subtype level, especially in the Tropics.


Conflict of interest statement

Competing Interests: The authors have declared that no competing interests exist.

Figures

Figure 1
Figure 1. Summary of incidence data.
Data on weekly number of isolates by type and subtype were collected from FluNet (WHO) and summarized for 19 countries—arranged from southernmost to northernmost, with the black line dividing the two hemispheres—for influenza seasons from 1997 to 2005. For H3 and H1 subtypes, totals were adjusted to account for type A isolates that were not further subtyped. For all types and subtypes, the adjusted number of weekly isolates was increased by one to remove any zero values. The natural log of the results were plotted by country for (i) H3, (ii) H1, and (iii) B on a color scale, with white representing either zero isolates or no data and brown representing the highest observed number of isolates for H3 (n = 4,057).
Figure 2
Figure 2. Mean aggregate incidence curves by type and subtype for the Northern Hemisphere.
Weekly incidence values for each type and subtype were summed for the Northern Hemisphere for each of the nine study seasons and normalized as a percentage of the total number of isolates of that particular type or subtype recorded over the nine year study period. The average value for each week (±SE) were plotted versus time for each type and subtype. The profiles clearly show that influenza B lags the other two subtypes (see text).
Figure 3
Figure 3. Type and subtype dominance.
(i) Mean proportion of annual isolates belonging to each type or subtype, averaged across the nine study seasons, were plotted for each country. (ii–iii) The proportion of annual isolates belonging to each type or subtype was averaged across all countries in both the (ii) Northern and (iii) Southern hemisphere and plotted for each of the nine seasons.
Figure 4
Figure 4. Annual type and subtype epidemic growth rates by hemisphere.
The epidemic growth rate (G) was calculated for each country by dividing the annual sum of adjusted weekly isolates for year “t” by the sum for year “t-1.” The average value of G for each hemisphere was determined by taking the geometric mean of the individual country values. To emphasize the difference between positive and negative growth, the natural log of the growth rates were plotted for (i) H3, (ii) H1, and (iii) B. The scatter plot shows the values of G for individual countries in the given season, to give an idea of the observed variation. Note that the values for 1998 and 1999 in the Southern Hemisphere are based on only three countries, as Argentina had no data available during the 1998 influenza season.
Figure 5
Figure 5. Mean type and subtype epidemic week versus distance from the equator.
Mean week of each epidemic was determined for all countries, and the arithmetic mean (± SE) of these values for each country was plotted versus distance from the equator for (i) H3, (ii) H1, and (iii) B. The red lines indicate best fit lines for each type or subtype.

References

    1. Simonsen L. The global impact of influenza on morbidity and mortality. Vaccine. 1999;17(suppl. 1):S3–S10. - PubMed
    1. Cox NJ, Subbarao K. Global Epidemiology of Influenza: Past and Present. Ann Rev Med. 2000;51:407–421. - PubMed
    1. Viboud C, Alonso WJ, Simonsen L. Influenza in Tropical Regions. PLoS Med. 2006;3(4):e89. - PMC - PubMed
    1. Nguyen-Van-Tam JS. Epidemiology of Influenza. In: Nicholson KG, Webster RG, Hay AJ, editors. Textbook of Influenza. Malden: Blackwell Science; 1998. pp. 181–206.
    1. Kilbourne ED, Schulman JL. Airborne Transmission of Influenza Virus Infection in Mice. Nature. 1961;195:1129–1130. - PubMed

Publication types