

High resolution population maps for low income nations: combining land cover and census in East Africa
- PMID: 18074022
- PMCID: PMC2110897
- DOI: 10.1371/journal.pone.0001298
High resolution population maps for low income nations: combining land cover and census in East Africa
Abstract
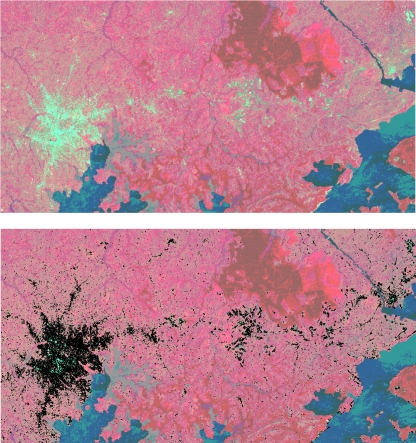
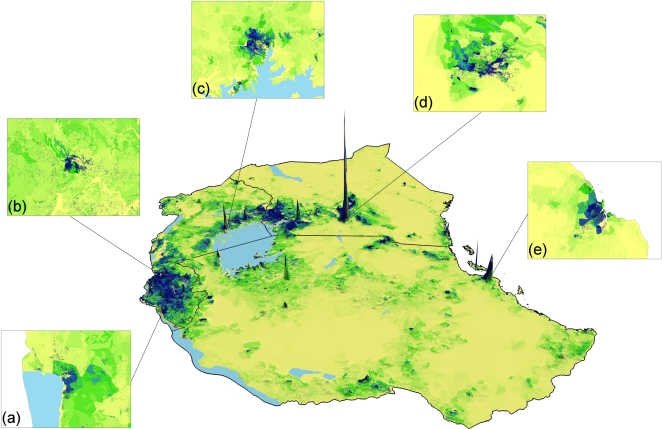
Background: Between 2005 and 2050, the human population is forecast to grow by 2.7 billion, with the vast majority of this growth occurring in low income countries. This growth is likely to have significant social, economic and environmental impacts, and make the achievement of international development goals more difficult. The measurement, monitoring and potential mitigation of these impacts require high resolution, contemporary data on human population distributions. In low income countries, however, where the changes will be concentrated, the least information on the distribution of population exists. In this paper we investigate whether satellite imagery in combination with land cover information and census data can be used to create inexpensive, high resolution and easily-updatable settlement and population distribution maps over large areas.
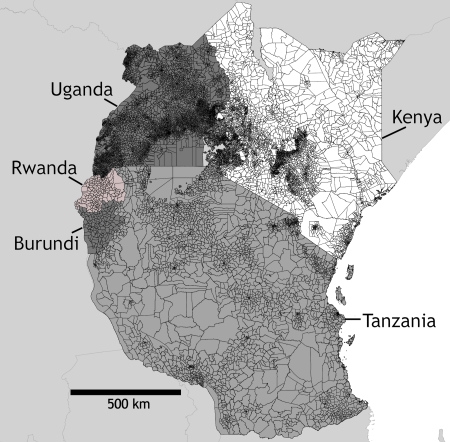
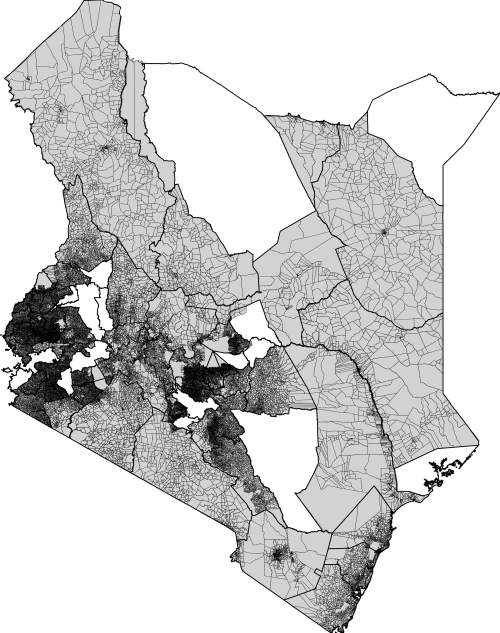
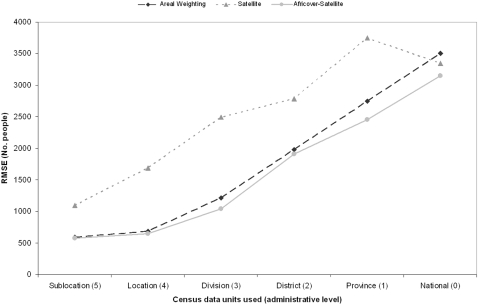
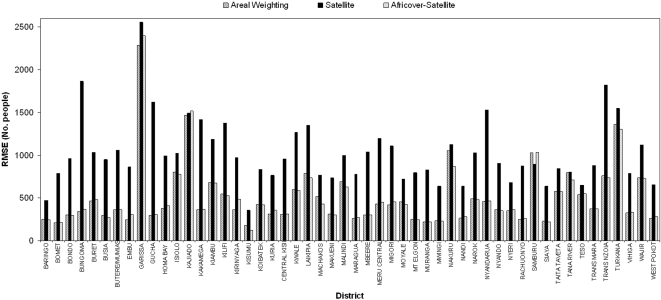
Methodology/principal findings: We examine various approaches for the production of maps of the East African region (Kenya, Uganda, Burundi, Rwanda and Tanzania) and where fine resolution census data exists, test the accuracies of map production approaches and existing population distribution products. The results show that combining high resolution census, settlement and land cover information is important in producing accurate population distribution maps.
Conclusions: We find that this semi-automated population distribution mapping at unprecedented spatial resolution produces more accurate results than existing products and can be undertaken for as little as $0.01 per km(2). The resulting population maps are a product of the Malaria Atlas Project (MAP: http://www.map.ox.ac.uk) and are freely available.
Conflict of interest statement
Figures
References
-
- United Nations Population Division. New York: United Nations; 2006. World population prospects, 2006 revision.
-
- United Nations Population Division. New York: United Nations; 2005. World urbanization prospects, 2005 revision.
-
- Campbell M, Cleland J, Ezeh A, Prata N. Return of the population growth factor. Science. 2007;315:1501–1502. - PubMed
Publication types
MeSH terms
Grants and funding
LinkOut - more resources
Full Text Sources
