. 2008 Mar;73(6):716-23.
doi: 10.1038/sj.ki.5002718. Epub 2007 Dec 12.

Angiotensin mediates renal fibrosis in the nephropathy of glycogen storage disease type Ia

Affiliations

Angiotensin mediates renal fibrosis in the nephropathy of glycogen storage disease type Ia

W H Yiu et al. Kidney Int. 2008 Mar.

Abstract

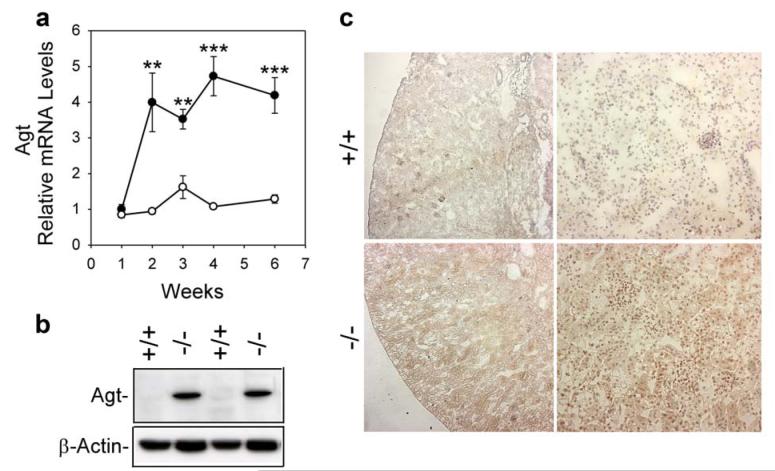
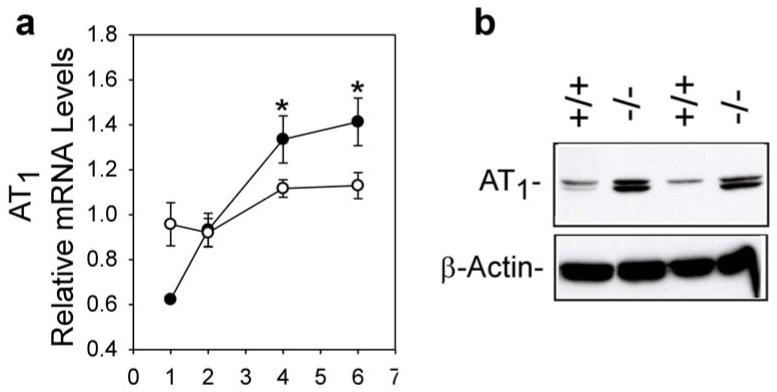
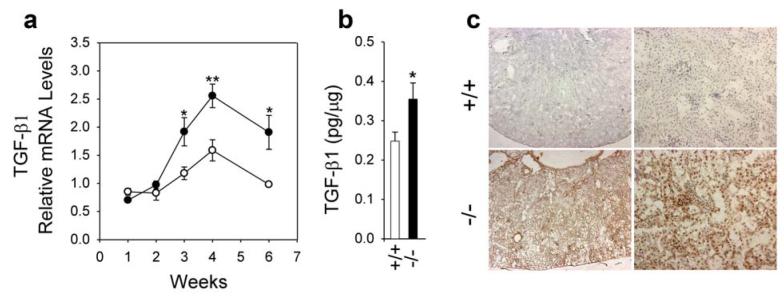
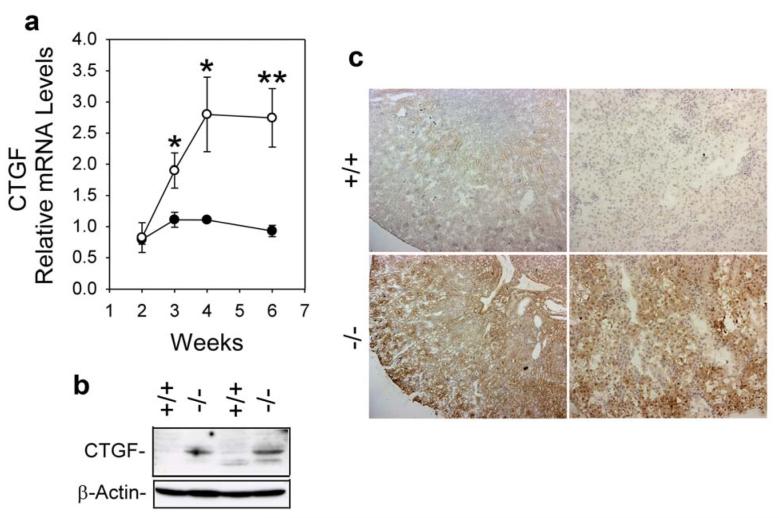
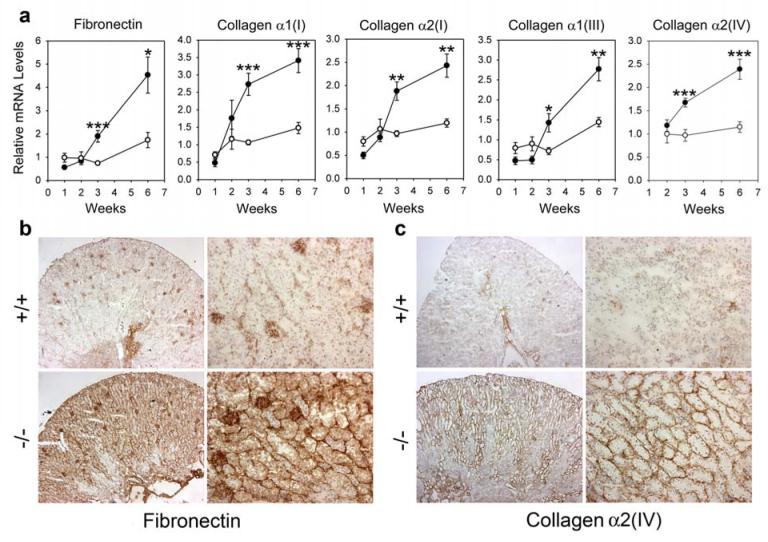
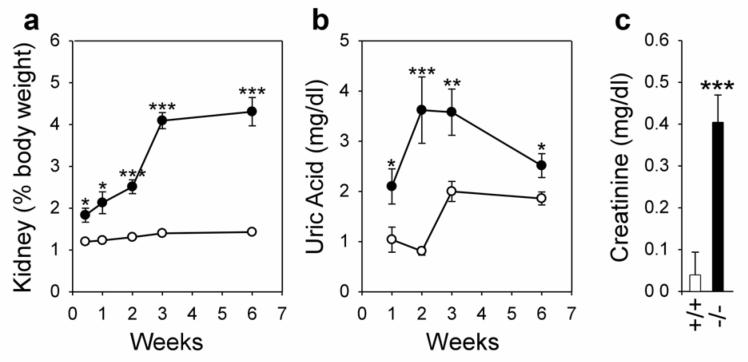
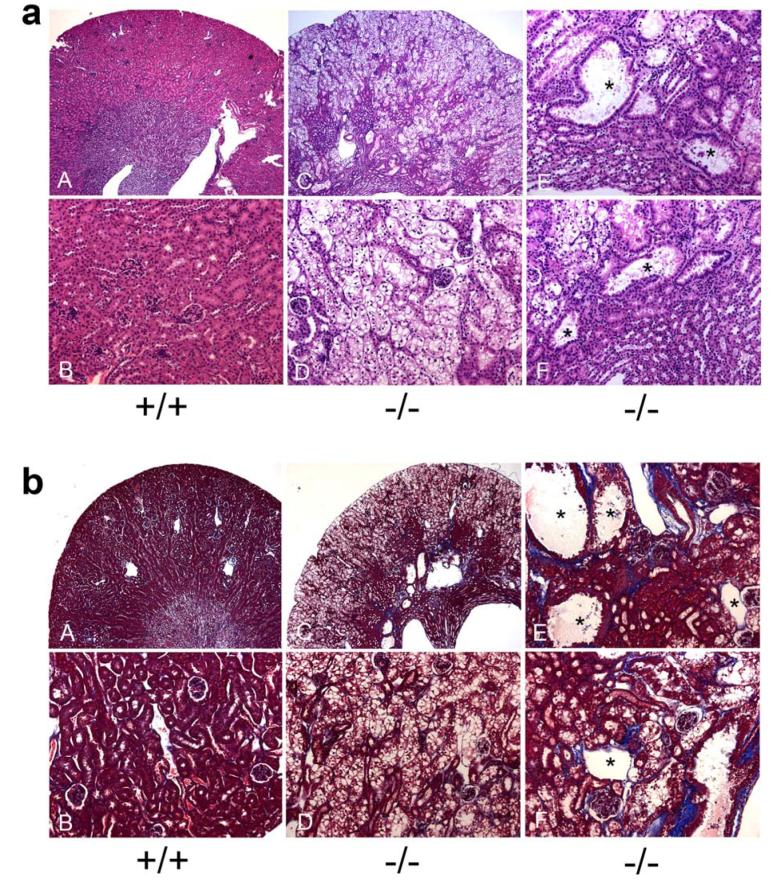
Patients with glycogen storage disease type Ia (GSD-Ia) develop renal disease of unknown etiology despite intensive dietary therapies. This renal disease shares many clinical and pathological similarities to diabetic nephropathy. We studied the expression of angiotensinogen, angiotensin type 1 receptor, transforming growth factor-beta1, and connective tissue growth factor in mice with GSD-Ia and found them to be elevated compared to controls. While increased renal expression of angiotensinogen was evident in 2-week-old mice with GSD-Ia, the renal expression of transforming growth factor-beta and connective tissue growth factor did not increase for another week; consistent with upregulation of these factors by angiotensin II. The expression of fibronectin and collagens I, III, and IV was also elevated in the kidneys of mice with GSD-Ia, compared to controls. Renal fibrosis was characterized by a marked increase in the synthesis and deposition of extracellular matrix proteins in the renal cortex and histological abnormalities including tubular basement membrane thickening, tubular atrophy, tubular dilation, and multifocal interstitial fibrosis. Our results suggest that activation of the angiotensin system has an important role in the pathophysiology of renal disease in patients with GSD-Ia.


Figures

Figure 1
Figure 1. Analysis of renal expression of the Ang system in GSD-Ia mice
(a) Quantification of Agt mRNA in wild-type (○) and GSD-Ia (●) mice during postnatal development using real-time RT-PCR. Results are the mean ± SEM. Each point represents the average of 5 or more animals. **p < 0.01; ***p < 0.001. (b) Western-blot analysis of Agt in the kidneys of 6-week-old wild-type (+/+) and GSD-Ia (-/-) mice. (c) Immunohistochemical analysis of Agt, Ang I, and Ang II in the kidneys of GSD-Ia mice. Plates shown are kidneys from 6-week-old wild-type (+/+) and GSD-Ia (-/-) mice at magnifications of x50 (left panels) and x200 (right panels). Representative experiments are shown.
Figure 2
Figure 2. Analysis of renal expression of AT1 in GSD-Ia mice
(a) Quantification of AT1 mRNA in wild-type (○) and GSD-Ia (●) mice during postnatal development using real-time RT-PCR. Results are the mean ± SEM. Each point represents the average of 5 or more animals. *p < 0.05. (b) Western-blot analysis of AT1 in the kidneys of 6- week-old wild-type (+/+) and GSD-Ia (-/-) mice.
Figure 3
Figure 3. Analysis of renal expression of TGF-β1 in GSD-Ia mice
(a) Quantification of TGF-β1 mRNA in wild-type (○) and GSD-Ia (●) mice during postnatal development using real-time RT-PCR. Results are the mean ± SEM. Each point represents the average of 5 or more animals. *p < 0.05; **p < 0.01. (b) Quantification of TGF-β1 protein levels in the kidneys of 6-week-old wild-type (+/+; n = 14) and GSD-Ia (-/-; n = 14) mice by immunoassays. *p < 0.05. (c) Immunohistochemical analysis of TGF-β1 in the kidney of GSD-Ia mice. Plates shown are kidneys from 6-week-old wild-type (+/+) and GSD-Ia (-/-) mice at magnifications of x50 (left panels) and x200 (right panels). Representative experiments are shown.
Figure 4
Figure 4. Analysis of renal expression of CTGF in GSD-Ia mice
(a) Quantification of CTGF mRNA in wild-type (○) and GSD-Ia (●) mice during postnatal development using real-time RT-PCR. Results are the mean ± SEM. Each point represents the average of 5 or more animals. *p < 0.05; **p < 0.01. (b) Western-blot analysis of CTGF in the kidneys of 6-week-old wild-type (+/+) and GSD-Ia (-/-) mice. (c) Immunohistochemical analysis of CTGF in the kidney of GSD-Ia mice. Plates shown are kidneys from 6-week-old wild-type (+/+) and GSD-Ia (-/-) mice at magnifications of x50 (left panels) and x200 (right panels). Representative experiments are shown.
Figure 5
Figure 5. Analysis of renal expression of fibronectin and collagens in GSD-Ia mice
(a) Quantification of mRNA for fibronectin, collagen α1(I), α2(I), α1(III), and α2(IV) in wild-type (○) and GSD-Ia (●) mice during postnatal development using real-time RT-PCR. Results are the mean ± SEM. Each point represents the average of 5 or more animals. *p < 0.05; **p < 0.01; ***p < 0.001. (b and c) Immunohistochemical analysis of fibronectin (b) and collagen α2(IV) (c) deposition in the kidney of GSD-Ia mice. Plates shown are kidneys from 6-week-old wild-type (+/+) and GSD-Ia (-/-) mice at magnifications of x50 (left panels) and x200 (right panels). Representative experiments are shown.
Figure 6
Figure 6. The GSD-Ia mice manifest nephromegaly, hyperuricemia, and an abnormal increase in serum creatinine
(a) The weights of the kidneys relative to total body weight in wild-type (○) and GSD-Ia (●) mice during postnatal development. Each point represents the average of 5 or more animals. (b) Serum levels of uric acid in wild-type (○) and GSD-Ia (●) mice during postnatal development. Each point represents the average of 8 or more animals. (c) Serum levels of creatinine in 6-week-old wild-type (+/+; n = 19) and GSD-Ia (-/-; n = 21) mice. Values represent mean ± SEM. *p < 0.05; **p < 0.01; ***p < 0.001.
Figure 7
Figure 7. Histological analysis of the kidneys in GSD-Ia mice
(a) Plates show H&E stained kidney sections in 6-week-old wild-type (+/+) and GSD-Ia (-/-) mice at magnifications of x50 (A and C) and x200 (B, D-F). Representative experiments are shown. (b) Masson’s trichrome staining of kidney sections in 6-week-old wild-type (+/+) and GSD-Ia (-/-) mice at magnifications of x50 (A and C) and x200 (B, D-F). Interstatitial fibrosis is shown by the blue colored staining of the collagen fibers. The dilated tubules are denoted by asterisks.

References

    1. Chou JY, Matern D, Mansfield BC, Chen YT. Type I glycogen storage diseases: disorders of the glucose-6-phosphatase complex. Curr Mol Med. 2002;2:121–143. - PubMed
    1. von Gierke E. Hepato-nephro-megalia glycogenica (Glykogenspeicher-krankheit der Leber und Nieren) Beitr Pathol Anat. 1929;82:497–513.
    1. Chen YT, Coleman RA, Scheinman JI, et al. Renal disease in type I glycogen storage disease. N. Engl J Med. 1988;318:7–11. - PubMed
    1. Verani R, Bernstein J. Renal glomerular and tubular abnormalities in glycogen storage disease type I. Arch Pathol Lab Med. 1988;112:271–274. - PubMed
    1. Baker L, Dahlem S, Goldfarb S, et al. Hyperfiltration and renal disease in glycogen storage disease, type I. Kidney Int. 1989;35:1345–1350. - PubMed

Publication types

MeSH terms