. 2007 Dec;5(12):e324.
doi: 10.1371/journal.pbio.0050324.

Mapping meiotic single-strand DNA reveals a new landscape of DNA double-strand breaks in Saccharomyces cerevisiae

Affiliations

Mapping meiotic single-strand DNA reveals a new landscape of DNA double-strand breaks in Saccharomyces cerevisiae

Cyril Buhler et al. PLoS Biol. 2007 Dec.

Erratum in

  • PLoS Biol. 2008 Apr 29;6(4). doi: 10.1371/journal.pbio.0060104

Abstract

DNA double-strand breaks (DSBs), which are formed by the Spo11 protein, initiate meiotic recombination. Previous DSB-mapping studies have used rad50S or sae2Delta mutants, which are defective in break processing, to accumulate Spo11-linked DSBs, and report large (> or = 50 kb) "DSB-hot" regions that are separated by "DSB-cold" domains of similar size. Substantial recombination occurs in some DSB-cold regions, suggesting that DSB patterns are not normal in rad50S or sae2Delta mutants. We therefore developed a novel method to map genome-wide, single-strand DNA (ssDNA)-associated DSBs that accumulate in processing-capable, repair-defective dmc1Delta and dmc1Delta rad51Delta mutants. DSBs were observed at known hot spots, but also in most previously identified "DSB-cold" regions, including near centromeres and telomeres. Although approximately 40% of the genome is DSB-cold in rad50S mutants, analysis of meiotic ssDNA from dmc1Delta shows that most of these regions have substantial DSB activity. Southern blot assays of DSBs in selected regions in dmc1Delta, rad50S, and wild-type cells confirm these findings. Thus, DSBs are distributed much more uniformly than was previously believed. Comparisons of DSB signals in dmc1, dmc1 rad51, and dmc1 spo11 mutant strains identify Dmc1 as a critical strand-exchange activity genome-wide, and confirm previous conclusions that Spo11-induced lesions initiate all meiotic recombination.


Conflict of interest statement

Competing interests. The authors have declared that no competing interests exist.

Figures

Figure 1
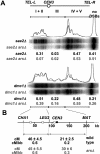
Figure 1. Delaying Replication Does Not Affect Crossing-Over in Wild Type or DSB Frequencies in dmc1Δ
(A) Southern blots of pulsed-field gels, probed with a left end–adjacent probe (nt 15,838–16,857) to detect DSBs on chromosome III in a normal chromosome or one with all three active replications origins on chr III-L deleted (arsΔ). DNA was prepared from sae2Δ (MJL2306), sae2Δ arsΔ (MJL2529), dmc1Δ (MJL2560), and dmc1Δ arsΔ (MJL2683) 6 h after initiation of meiosis. Quantification traces for each lane, normalized to total lane intensity, are shown (normal chr III-L, black; arsΔ, gray). DSB frequencies in the left arm (I + II), central “cold” region (III), and right arm (IV + V) domains [32] and frequencies of uncut chromosomes are expressed as fraction of total lane signal. Values are corrected to account for double cutting events (see Materials and Methods). The uncorrected values are as follows: for interval I + II: sae2Δ, 0.27; sae2Δ arsΔ, 0.07; dmc1Δ, 0.42; dmc1Δ arsΔ, 0.33. For interval III: sae2Δ, 0.02; sae2Δ arsΔ, 0.02; dmc1Δ, 0.13; dmc1Δ arsΔ, 0.11. For interval IV + V: sae2Δ, 0.3; sae2Δ arsΔ, 0.4; dmc1Δ, 0.24; dmc1Δ arsΔ, 0.3. (B) Frequencies of crossing-over in the indicated intervals (centiMorgans ± standard error), in wild type (MJL3237) or strains with an arsΔ chrIII-L (MJL3236). Black circle indicates centromere; white squares indicate replication origins (ARS305, ARS306, ARS307) that are deleted in replication-delayed chromosome arm.
Figure 2
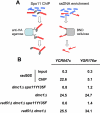
Figure 2. Enrichment of DSB-associated DNA
(A) Cartoon illustrating enrichment procedures used (see Protocol S1 for details). DSB ends formed in rad50S can be enriched by immunoprecipitation of Spo11 covalently linked to break ends (here with antibody directed against a C-terminal 3xHA tag). DSBs formed in dmc1Δ and rad51Δ dmc1Δ can be enriched by BND cellulose purification of ssDNA ends. (B) Quantitative PCR measurement of enrichment relative to ribosomal DNA (rDNA) for sequences near DSB hot spots (YCR047c and YGR176w). Spo11 enrichment ratios for rad50S (MJL1083) were determined from input samples and immunoprecipitates (ChIP). ssDNA enrichment ratios for dmc1Δ (MJL3095), spo11Y135F dmc1Δ (MJL3096), rad51Δ dmc1Δ (MJL3272), and spo11Y135F rad51Δ dmc1Δ (MJL3274) were determined using BND cellulose eluates. DSB frequencies at YGR176w and YCR047c, as determined on Southern blots, are ∼10% of chromosomes (Figure 5 and unpublished data); thus, the overall selectivity for DSBs in both Spo11 ChIP and ssDNA enrichment is 200–300-fold above background.
Figure 3
Figure 3. Examples of Concordance and Discordance between DSBs in dmc1Δ and rad50S
In each plot, normalized, unsmoothed array signals (average of two experiments) are as follows: orange, Spo11 ChIP from rad50S (MJL1083); blue, BND cellulose–enriched ssDNA from dmc1Δ (MJL3095); red, BND cellulose–enriched ssDNA from spo11Y135F dmc1Δ (MJL 3096). (A) Three concordant regions where DSB signals are similar in rad50S and dmc1Δ. x-axes, chromosome coordinates (kb) on chromosomes III (YCR047c), IV (YDR187c), and VII (YGR176w). (B) DSB signals on chromosome XI. Insets show three discordant regions where the DSB signal in dmc1Δ is much greater than in rad50S. Green dot indicates the centromere.
Figure 4
Figure 4. Summary of DSB Distributions
(A) The number of DSB hot spots in dmc1Δ (blue) exceeds the number in rad50S (orange) at all DSB intensities. DSB peaks were identified from smoothed data (Materials and Methods). Total DSB hot spots with peak heights greater than the indicated multiple of background are plotted. (B) More of the genome is close to a DSB in dmc1Δ than in rad50S. The graph shows the fraction of the genome less than the indicated distance from a DSB peak with a height greater than 2-fold or 5-fold above background. (C) DSBs are reduced in a 8–10-kb region near centromeres. All 32 chromosome arms were aligned at the centromere, and the average unsmoothed enrichment signal was determined for all elements in 2-kb bins (>200 array elements/bin). Horizontal lines indicate genome-wide average. (D) DSB activity near chromosome ends. All 32 chromosome arms were aligned at chromosome ends, and the average enrichment signal was determined in 2-kb bins as for centromeres. Horizontal lines indicate genome-wide average. Black dots indicate number of array elements per 2-kb bin with homology to the SK1 strains used here (see Materials and Methods).
Figure 5
Figure 5. Confirmation of DSB Patterns
(A) Spo11 ChIP ratios from rad50S (orange) and BND cellulose enriched ssDNA ratios from dmc1Δ (blue) on chromosome III. Green dot indicates the centromere. (B–E) Southern blot detection of DSBs in the indicated regions. Blots contain DNA from meiotic (5 h) samples of spo11-Y135F dmc1Δ (MJL3096), dmc1Δ (MJL3095), and rad50S (MJL1083) cells, and DNA from mitotic wild-type (MJL1578) cells. DSB frequencies (% total lane signal) are indicated to the right of each blot (- denotes no signal detected above background). Blots were hybridized with radioactive probes (*) internal to YCL011c, YCR007c, YCR052w open reading frames (for (B), (C), and (E), respectively; details supplied upon request), and YCR019w in (D). Restriction enzymes used: (B and C): XhoI; (D): PvuII; and (E): BglII. DNA length standards (first lane in each blot) contain a HindIII digest of phage λ DNA.
Figure 6
Figure 6. DSBs During a Wild-Type Sporulation
(A) DSBs in the concordant YCR047c region. Upper left: Southern blot showing DSBs in DNA from wild type (MJL1578, indicated hr after initiating sporulation), dmc1Δ (MJL3095, 5 h), and rad50S (MJL1083, 5 hr). Arrows indicate open reading frames in the region, top to bottom; YCR047c; YCR048w; YCR051w; YCR052w (probe). Digest: BglII. DNA length standard (first lane) contains a BstEII digest of phage λ DNA Upper right: density trace, normalized to total lane density, of the indicated lanes. DSB peak intensities (% total lane density) are sum of all 5 detectable DSB bands. Lower left: background normalized average DSB signals from microarrays for the same region. Open reading frames, left to right: YCR045c; YCR046c; YCR047c; YCR048w; YCR051w; YCR052w. Lower right: DSB timing in wild type, for the DSB sum shown in density trace. (B) DSBs in the discordant YLR436c region. Panels as in (A). Open reading frames, top to bottom: YLR440c; YLR439w; YLR438w; YLR437c; YLR436c (probe). Digest: BstEII. DNA length standards (first lane) contain a HindIII digest of phage λ DNA.

References

    1. Gerton JL, Hawley RS. Homologous chromosome interactions in meiosis: diversity amidst conservation. Nat Rev Genet. 2005;6:477–487. - PubMed
    1. Koehler KE, Hawley RS, Sherman S, Hassold T. Recombination and nondisjunction in humans and flies. Hum Mol Genet. 1996;5:1495–1504. - PubMed
    1. Keeney S. Mechanism and control of meiotic recombination initiation. Curr Top Dev Biol. 2001;52:1–53. - PubMed
    1. Bergerat A, de Massy B, Gadelle D, Varoutas PC, Nicolas A, et al. An atypical topoisomerase II from Archaea with implications for meiotic recombination. Nature. 1997;386:414–417. - PubMed
    1. Keeney S, Giroux CN, Kleckner N. Meiosis-specific DNA double-strand breaks are catalyzed by Spo11, a member of a widely conserved protein family. Cell. 1997;88:375–384. - PubMed

Publication types

MeSH terms