

Tissue oxygenation in a murine SCC VII tumor after X-ray irradiation as determined by EPR spectroscopy
- PMID: 18077029
- PMCID: PMC2362098
- DOI: 10.1016/j.radonc.2007.11.020
Tissue oxygenation in a murine SCC VII tumor after X-ray irradiation as determined by EPR spectroscopy
Abstract
Purpose: The goal of this study was to clarify the dynamics of oxygenation (partial pressure of oxygen, pO(2)) in SCC VII murine tumors in mice after X-ray irradiation.
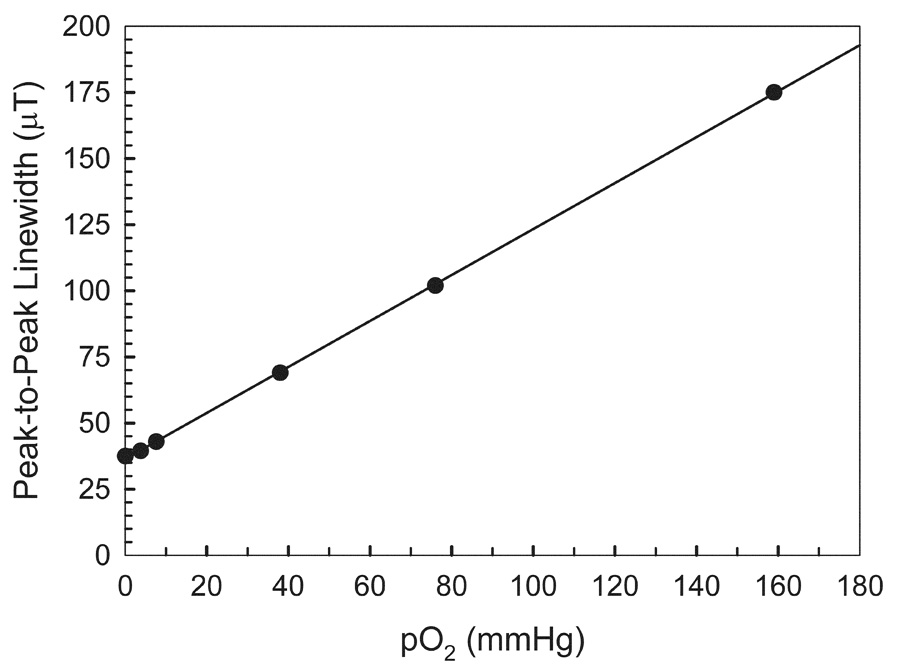
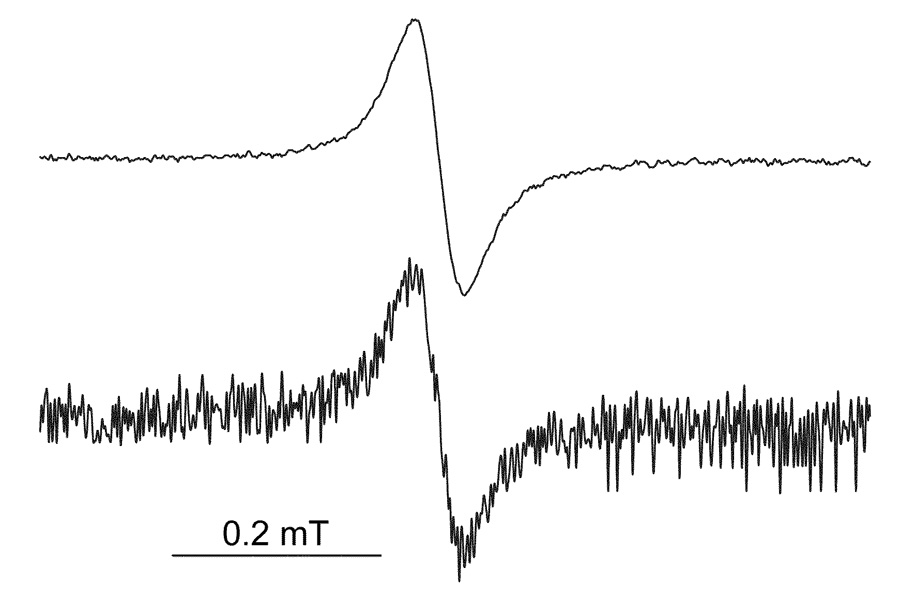
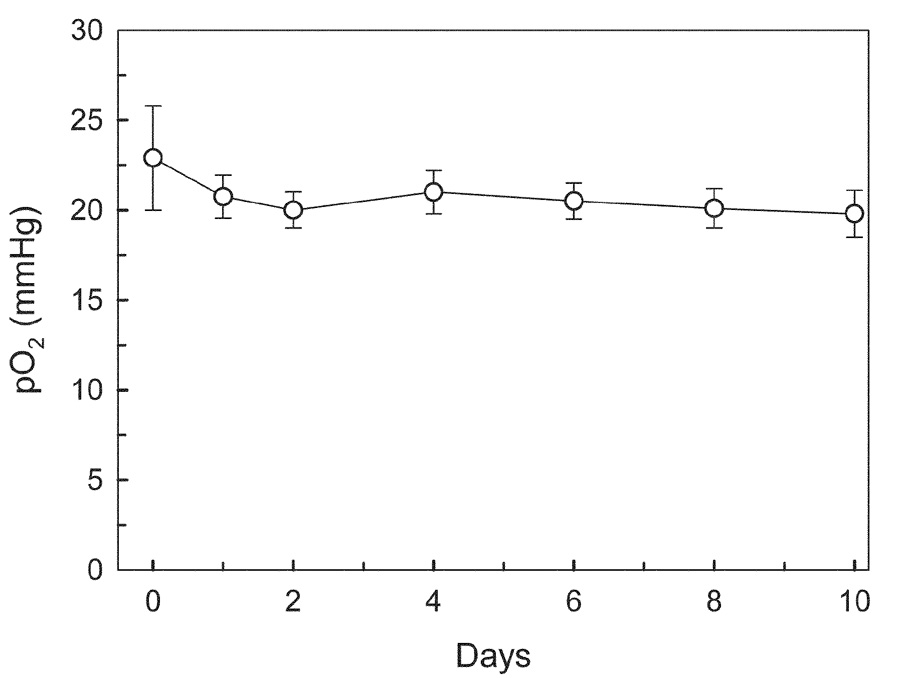
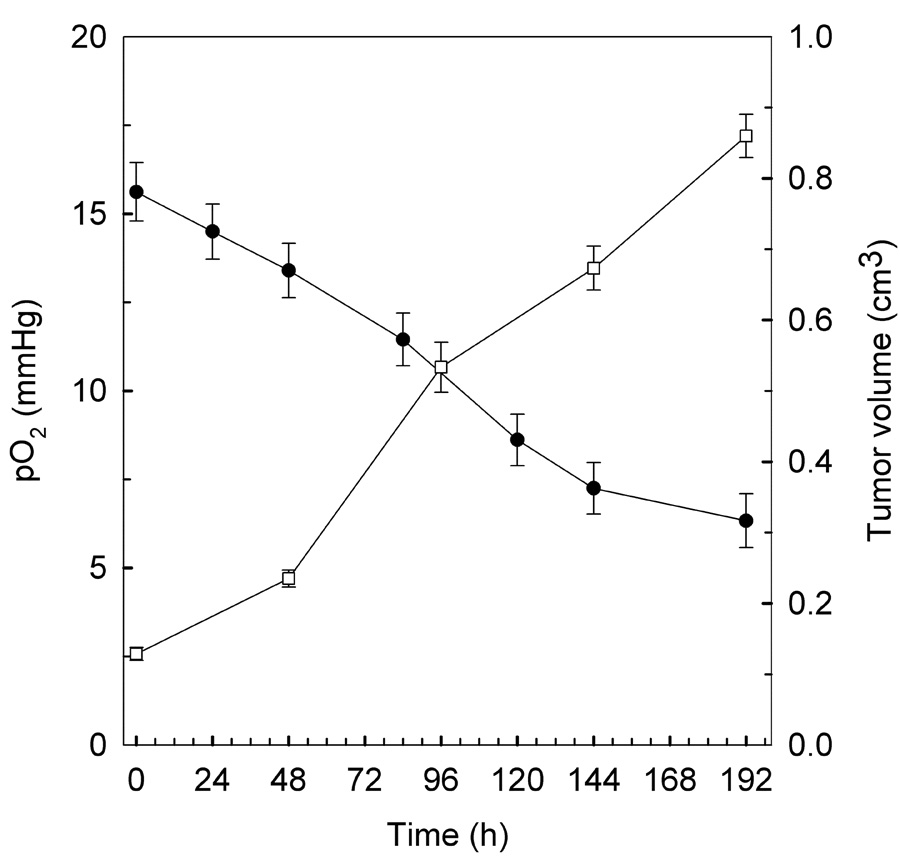
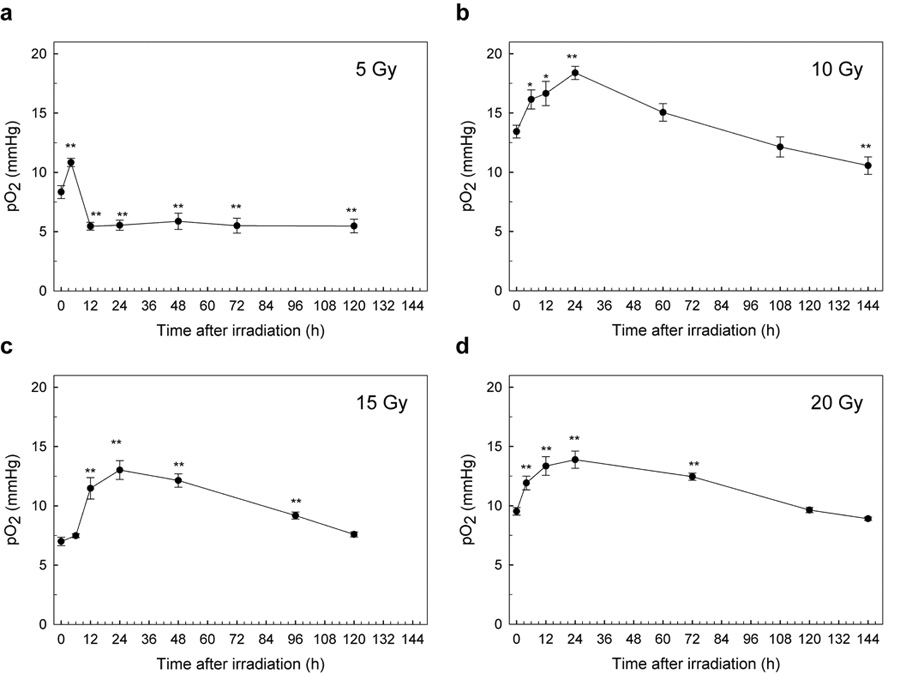
Materials and methods: Changes in pO(2) in tumors were measured by 1.2-GHz electron paramagnetic resonance (EPR) spectroscopy after they were exposed to various doses of irradiation. The pO(2) in tumors was followed for up to six days after irradiation at doses of 0, 5, 10, 15, and 20 Gy. Paramagnetic crystals were used as an oximetry probe and implanted into normal or tumor tissues in mice for prolonged periods.
Results: The pattern of tumor oxygen after a single dose of radiation with the 5-Gy dose was different from those with other doses (10, 15, and 20 Gy). After 5 Gy, pO(2) increased rapidly (P<0.01, Student's t test) and then returned to the level observed before irradiation by 12h (P<0.01). In contrast, after 10, 15, or 20 Gy, pO(2) increased rapidly by 6h after irradiation, continued to increase until at least 24h (P<0.01), and then gradually decreased.
Conclusions: In tumors that received 5 Gy, post-irradiation increases in pO(2) at 4h after irradiation were detected by EPR oximetry (P<0.01) noninvasively.
Conflict of interest statement
Figures
References
-
- Ling CC, Humm J, Larson S, et al. Towards multidimensional radiotherapy (MD-CRT): biological imaging and biological conformality. Int J Radiat Oncol Biol Phys. 2000;47:551–560. - PubMed
-
- Hall EJ. Oxygen effect and reoxygenation. In: Hall EJ, editor. Radiobiology for the radiologist. Sixth edition. Philadelphia: Lippincott Williams & Wilkins; 2006. pp. 85–105.
-
- Brizel DM, Sibley GS, Prosnitz LR, et al. Tumor hypoxia adversely affects the prognosis of carcinoma of the head and neck. Int J Radiat Oncol Biol Phys. 1997;38:285–289. - PubMed
-
- Teicher BA. Hypoxia and drug resistance. Cancer Metast Rev. 1994;13:139–168. - PubMed
-
- Hockel M, Schlenger K, Aral B, et al. Association between tumor hypoxia and malignant progression in advanced cancer of the uterine cervix. Cancer Res. 1996;56:4509–4515. - PubMed
Publication types
MeSH terms
Substances
Grants and funding
LinkOut - more resources
Full Text Sources
Medical
Research Materials
