

Towards an independent brain-computer interface using steady state visual evoked potentials
- PMID: 18077208
- PMCID: PMC2274834
- DOI: 10.1016/j.clinph.2007.09.121
Towards an independent brain-computer interface using steady state visual evoked potentials
Abstract
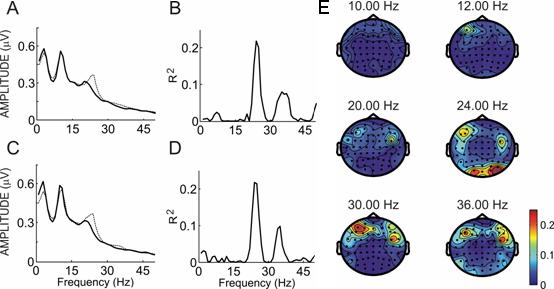
Objective: Brain-computer interface (BCI) systems using steady state visual evoked potentials (SSVEPs) have allowed healthy subjects to communicate. However, these systems may not work in severely disabled users because they may depend on gaze shifting. This study evaluates the hypothesis that overlapping stimuli can evoke changes in SSVEP activity sufficient to control a BCI. This would provide evidence that SSVEP BCIs could be used without shifting gaze.
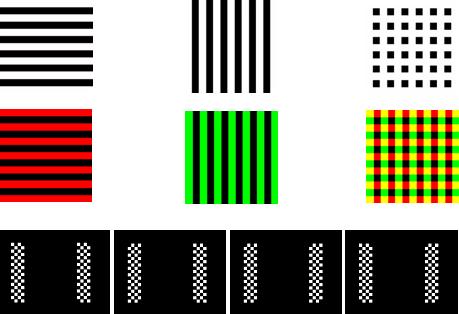
Methods: Subjects viewed a display containing two images that each oscillated at a different frequency. Different conditions used overlapping or non-overlapping images to explore dependence on gaze function. Subjects were asked to direct attention to one or the other of these images during each of 12 one-minute runs.
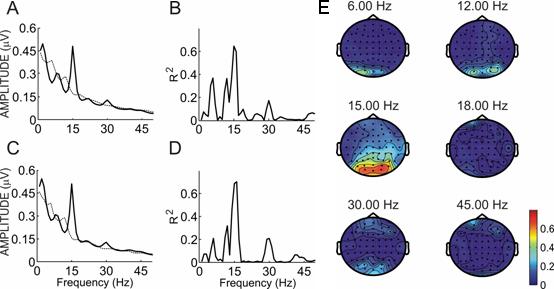
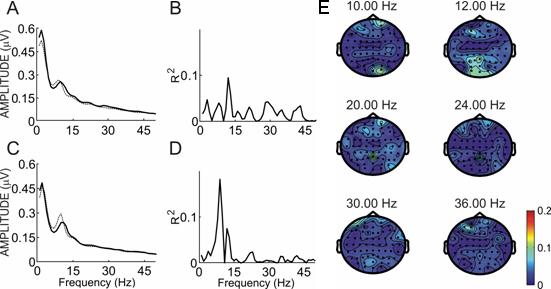
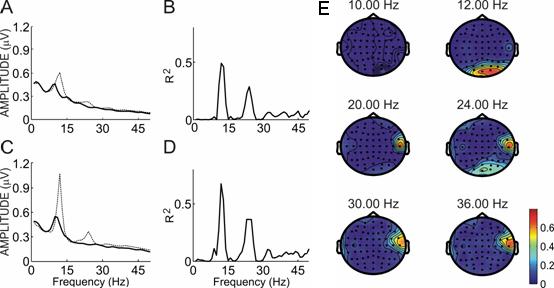
Results: Half of the subjects produced differences in SSVEP activity elicited by overlapping stimuli that could support BCI control. In all remaining users, differences did exist at corresponding frequencies but were not strong enough to allow effective control.
Conclusions: The data demonstrate that SSVEP differences sufficient for BCI control may be elicited by selective attention to one of two overlapping stimuli. Thus, some SSVEP-based BCI approaches may not depend on gaze control. The nature and extent of any BCI's dependence on muscle activity is a function of many factors, including the display, task, environment, and user.
Significance: SSVEP BCIs might function in severely disabled users unable to reliably control gaze. Further research with these users is necessary to explore the optimal parameters of such a system and validate online performance in a home environment.
Figures
References
-
- Allison BZ. P3 or not P3: Toward a Better P300 BCI. La Jolla; UC San Diego: 2003.
-
- Allison BZ, Pineda JA. ERPs evoked by different matrix sizes: Implications for a brain computer interface (BCI) system. IEEE Trans Neural Syst Rehabil Eng. 2003 Jun;11(2):110–113. - PubMed
-
- Allison BZ, Pineda JA. Effects of SOA and flash pattern manipulations on ERPs, performance, and preference: Implications for a BCI system. International Journal of Psychophysiology. 2006 Feb;59(2):127–140. - PubMed
-
- Allison BZ, Boccanfuso JB, Agocs C, McCampbell LA, Leland DS, Gosch C, Moore Jackson M. Sustained use of an SSVEP BCI under adverse conditions. Journal of Cognitive Neuroscience Supplement. 2006:129.
-
- Allison BZ, Wolpaw EW, Wolpaw JR. Poll E, editor. Brain computer interface systems: Progress and prospects. British review of medical devices. Jul;4(4):463–474. - PubMed
Publication types
MeSH terms
Grants and funding
LinkOut - more resources
Full Text Sources
